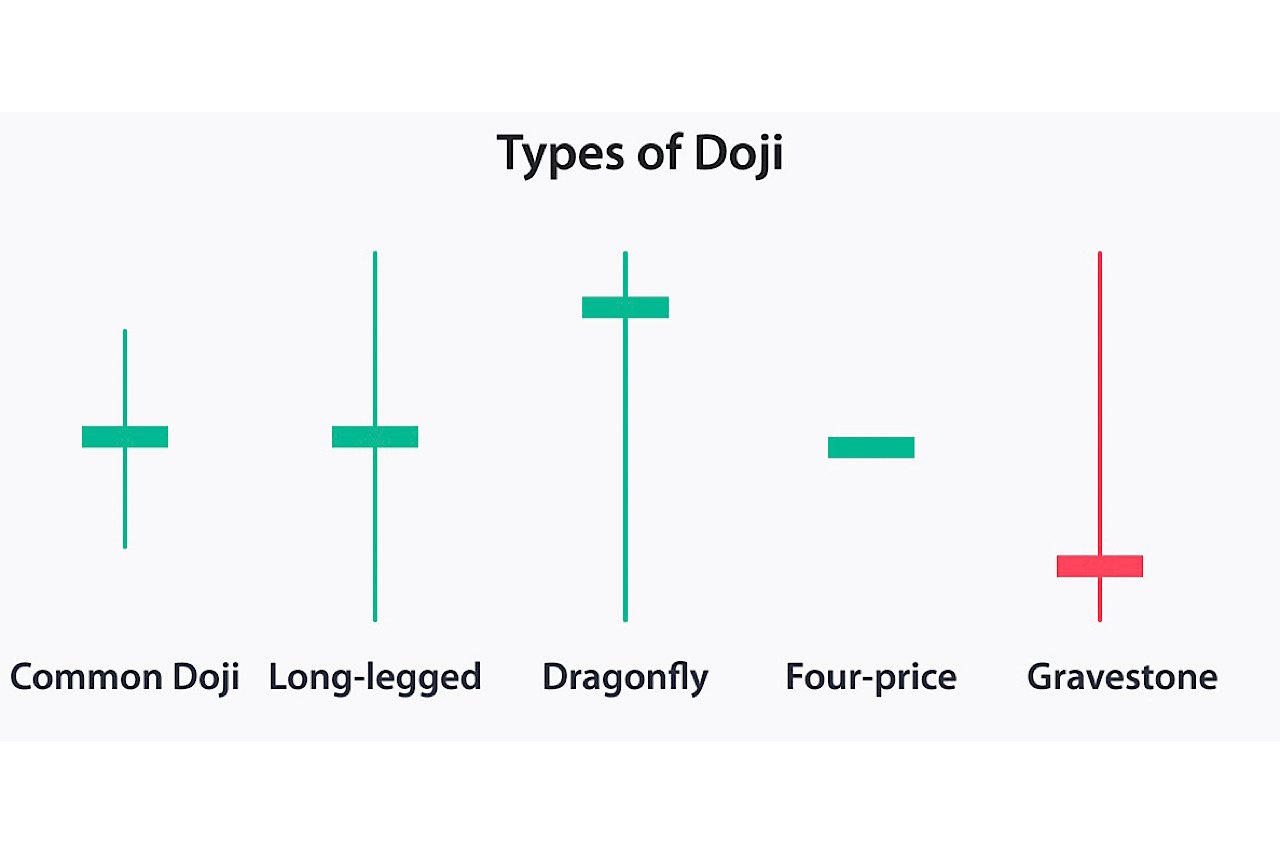
The doji candlestick is a key candlestick pattern. When it forms, it indicates that the market opened and closed at the same price, reflecting a balance and indecision between buyers and sellers, with neither side in control. See the example below:
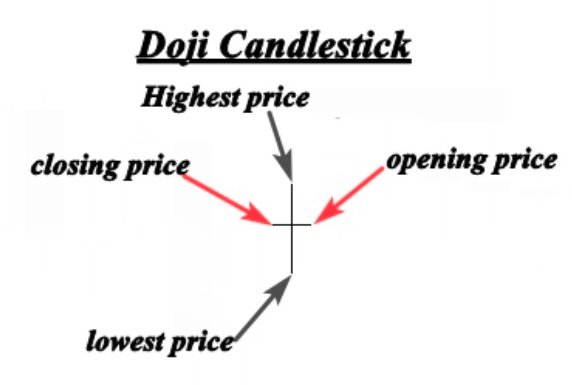
As shown, the Doji candlestick pattern has the same opening and closing price, signaling indecision in the market. When this pattern appears during an uptrend or downtrend, it often suggests a potential reversal. See another example below to explore this further.
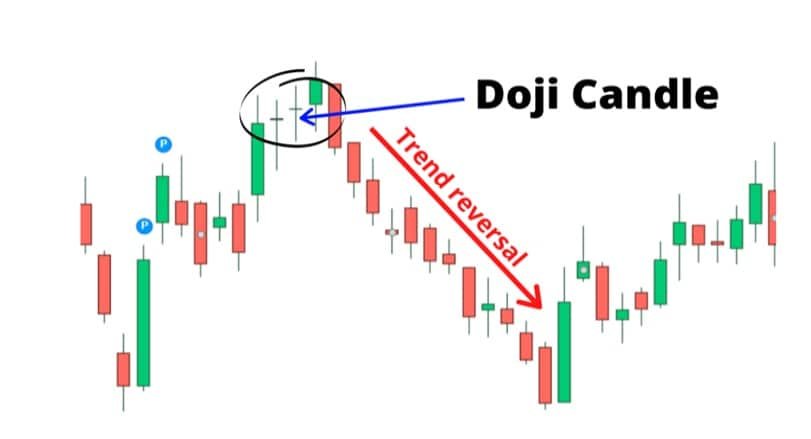
The chart above clearly demonstrates how the market changed direction after the Doji candlestick formed. Initially, the market was trending upwards, indicating that buyers were in control. However, the Doji pattern shows that buyers couldn’t sustain the higher price, and sellers pushed the market back to the opening price. This suggests a potential trend reversal.
Remember, a doji candlestick signifies balance and indecision in the market, often appearing during periods of consolidation after significant price movements. When found at the top or bottom of a trend, it indicates that the trend may be losing strength and a reversal could be imminent.
If you’re already in the trend, a doji candlesticki can be a signal to take profits, as it suggests the trend may be losing momentum. Alternatively, it can serve as an entry signal when combined with other technical analysis tools to confirm a potential reversal or continuation.
Discover Giant Hunter AI
The Dragonfly Doji pattern
The Dragonfly doji candlestick is a bullish candlestick pattern that forms when the open, high, and close are roughly the same price. What sets the Dragonfly Doji apart is its long lower tail, which indicates strong buying resistance and the buyers’ effort to push the market higher. See the example below:
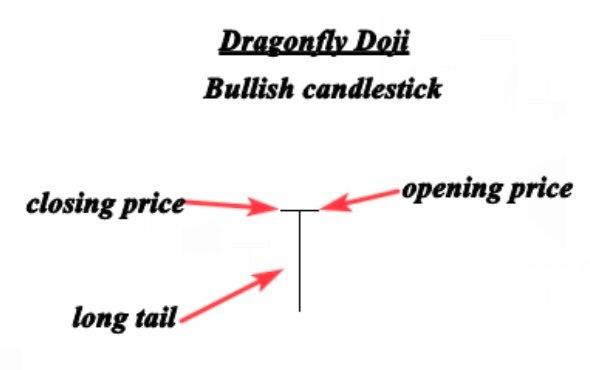
The illustration above shows a perfect dragonfly doji candlestick. The long lower tail indicates that supply and demand are approaching balance, suggesting the trend may be nearing a significant turning point. See the example below, which highlights a bullish reversal signal formed by the Dragonfly Doji.
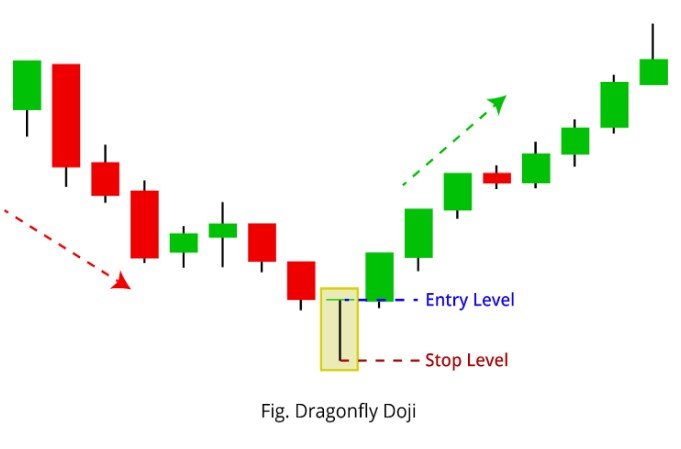
In the chart above, the market tested a previous support level, leading to a strong rejection from that area. The Dragonfly Doji, with its long lower tail, signals significant buying pressure in this zone. Identifying this candlestick pattern on your chart can help pinpoint where support and demand are located.
When the Dragonfly Doji forms in a downtrend, it’s interpreted as a bullish reversal signal. However, as I always emphasize, you shouldn’t rely solely on candlestick patterns. To increase the probability of successful trades, you’ll need to use other indicators and tools to confirm the signal.
Discover Giant Hunter AI
The Gravestone Doji
The Gravestone doji candlestick is the bearish counterpart to the Dragonfly Doji. It forms when the open and close are approximately the same price. What sets the Gravestone Doji apart is its long upper tail, which indicates that the market is testing a strong supply or resistance level. See the example below:
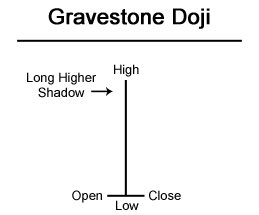
The image above shows a perfect gravestone doji. This pattern suggests that while buyers initially pushed prices above the open, sellers later took control and drove the price back down.
This shift indicates that the bulls are losing momentum, signaling that a market reversal may be imminent. See another illustration below:
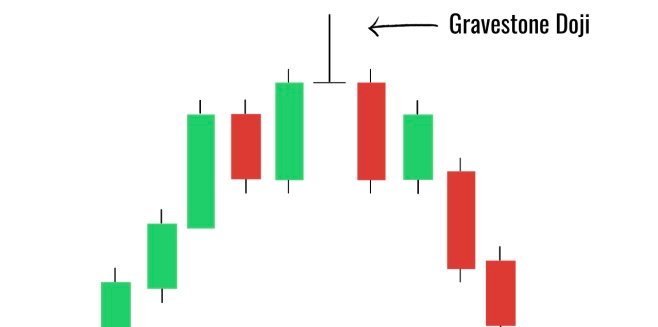
The chart above shows a gravestone doji at the peak of an uptrend, following a period of strong bullish activity. The formation of this candlestick pattern signals that buyers are losing control of the market. For the pattern to be reliable, it should appear near a resistance level.
As a trader, it’s important to consider the placement and context of the gravestone doji to interpret the signal accurately. I will cover how to do this in more detail in the upcoming chapters.
The morning star

The Morning Star pattern is a bullish reversal pattern, typically found at the bottom of a downtrend. It consists of three candlesticks:
- The first candlestick is bearish, showing that sellers are still in control of the market.
- The second candlestick is a small one, indicating that while sellers remain in control, they are unable to push the market much lower. This candle can be either bullish or bearish.
- The third candlestick is bullish, gapping up on the open and closing above the midpoint of the first candlestick’s body, signaling a strong trend reversal.
The Morning Star pattern demonstrates how buyers take control from sellers. When it occurs near a support level at the bottom of a downtrend, it is seen as a powerful signal of a potential trend reversal. See the illustration below:
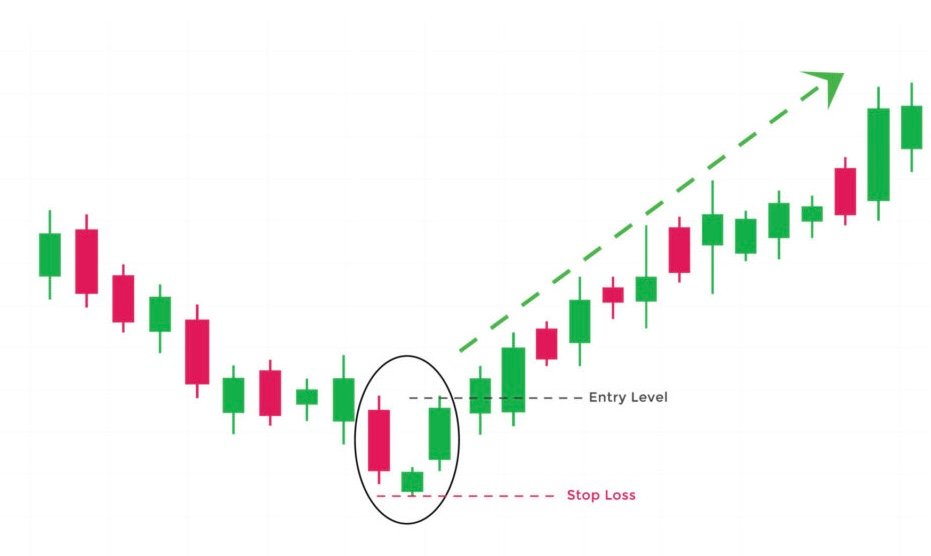
The chart above helps us identify the Morning Star pattern and highlights its significance when formed at the bottom of a downtrend. As shown, the pattern occurred within a clear bearish trend.
The first candle confirms the dominance of sellers, while the second candle represents market indecision. This second candle could be a Doji or any other candlestick pattern that signifies a pause in the market’s direction.
Discover Giant Hunter AI
The evening star pattern
The Evening Star pattern is a bearish reversal pattern that typically forms at the top of an uptrend. It consists of three candlesticks:
- The first candlestick is bullish, indicating that buyers are in control.
- The second candlestick is small and can be bullish, bearish, or even a Doji, representing indecision in the market.
- The third candlestick is a large bearish candle, signaling the shift in control from buyers to sellers.
Overall, the evening star is the bearish counterpart to the morning star pattern. See the example below:
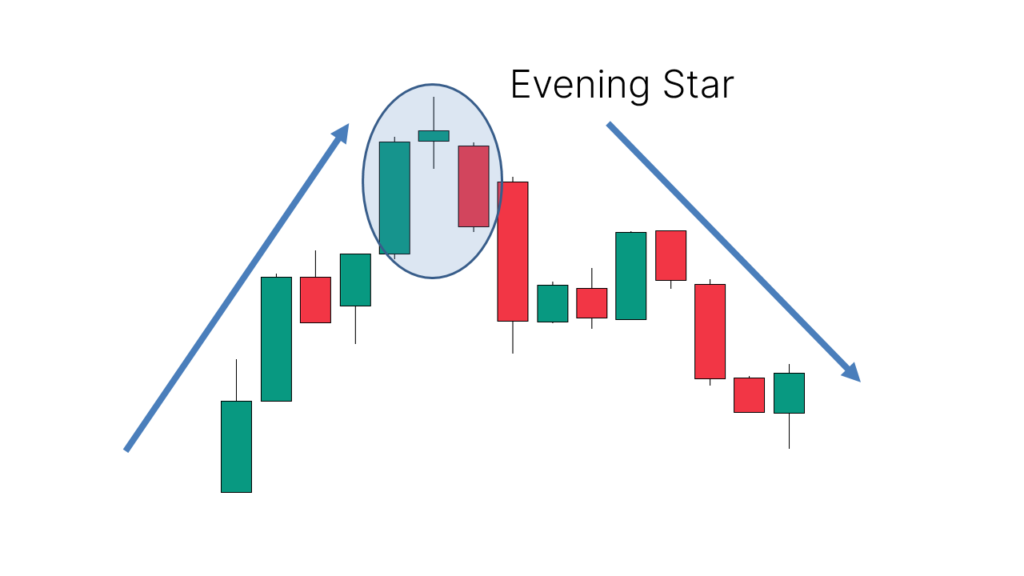
The first part of the Evening Star is a bullish candle, indicating that bulls are still driving the market higher, and everything seems to be going well.
However, the formation of the smaller second candlestick shows that while buyers are still in control, their momentum is weakening.
The third large bearish candle signals that the dominance of buyers has ended, and a bearish trend reversal is likely.
See another chart below that illustrates how the Evening Star can signal a significant trend reversal.
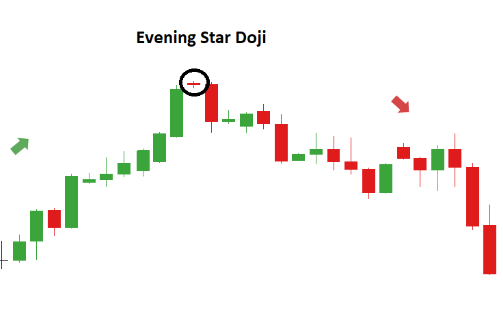
As shown, the market was in an uptrend, and the first candle in the pattern represents a strong move higher. The second candlestick is a small one, indicating price consolidation and indecision.
This suggests that the momentum from the first bullish candlestick is starting to fade. The final candlestick gaps lower than the previous one, confirming the reversal and signaling the start of a new downward trend.
The Hammer (pin bar)
The Hammer candlestick forms when the open, high, and close are roughly at the same price, with a long lower shadow. This long lower shadow signals a bullish rejection, showing that buyers are stepping in and attempting to push the market higher.
See the illustration below to see how it looks.
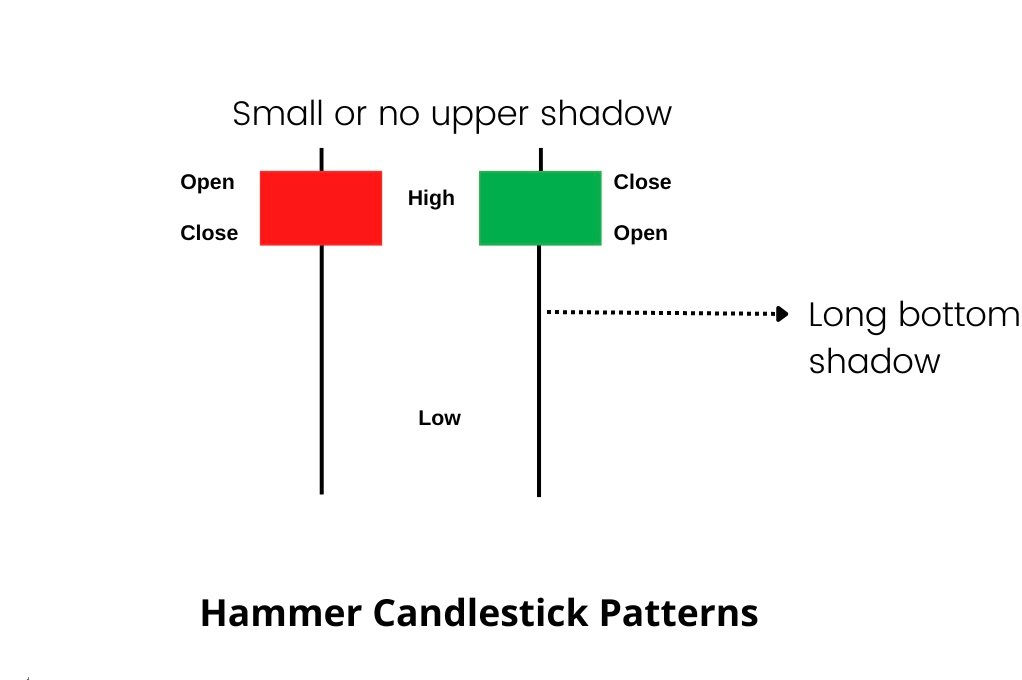
The Hammer is a reversal candlestick pattern that appears at the bottom of a downtrend.
It forms when sellers initially push the market lower after the open, but buyers step in and drive the price back up, causing the market to close higher than its lowest point.
See another example below:
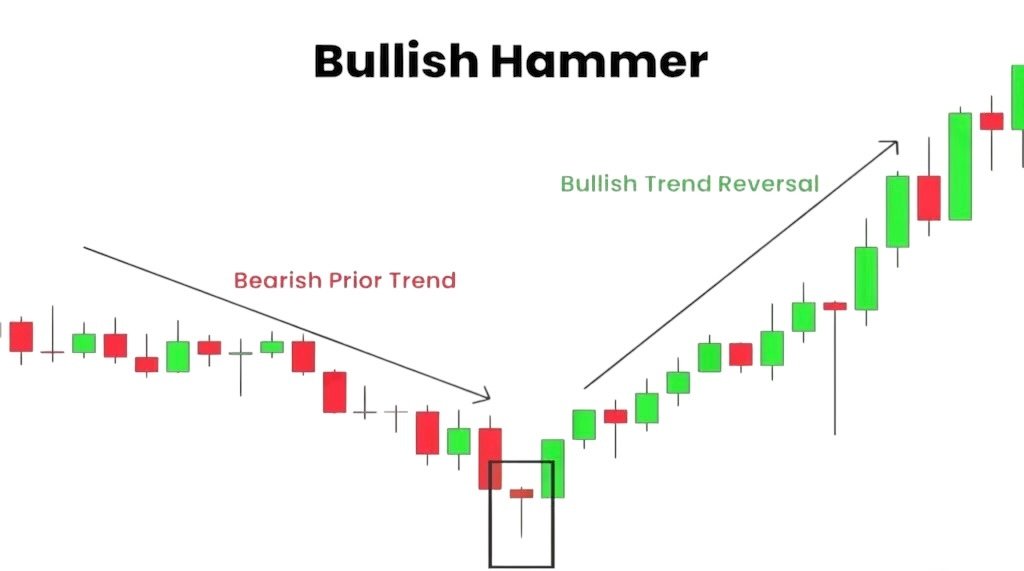
The market was heading downward, as you can see, and the hammer (pin bar) pattern was a notable reversal. The strong purchasing pressure from this point is symbolized by the extended shadow.
Sellers attempted to drive the market lower, but at that point, purchasing strength outweighed selling pressure, causing the trend to reverse.
Understanding the psychology that led to the creation of this pattern is crucial because it will help you make very accurate predictions about the direction of the market. In the upcoming chapters, we will discuss how to filter this signal and trade this pattern.
Discover Giant Hunter AI
The shooting star (bearish pin bar)
The shooting formation, which is distinguished by a small body and a lengthy upper shadow, is created when the open, low, and close prices are approximately equal.
It is the hammer’s bearish counterpart.
The shadow should be twice as long as the actual body, according to skilled specialists.
View the following example:

A flawless shooting star with a real little body and an above-lengthy shadow is depicted in the accompanying figure.
This pattern denotes a negative reversal signal when it appears during an uptrend.
The psychology underlying this pattern’s creation is that purchasers attempted to drive the market higher but were thwarted by pressure from sellers.
when a resistance level is close to where this candlestick forms. One should consider it a setup with high probability.
Below is another example:
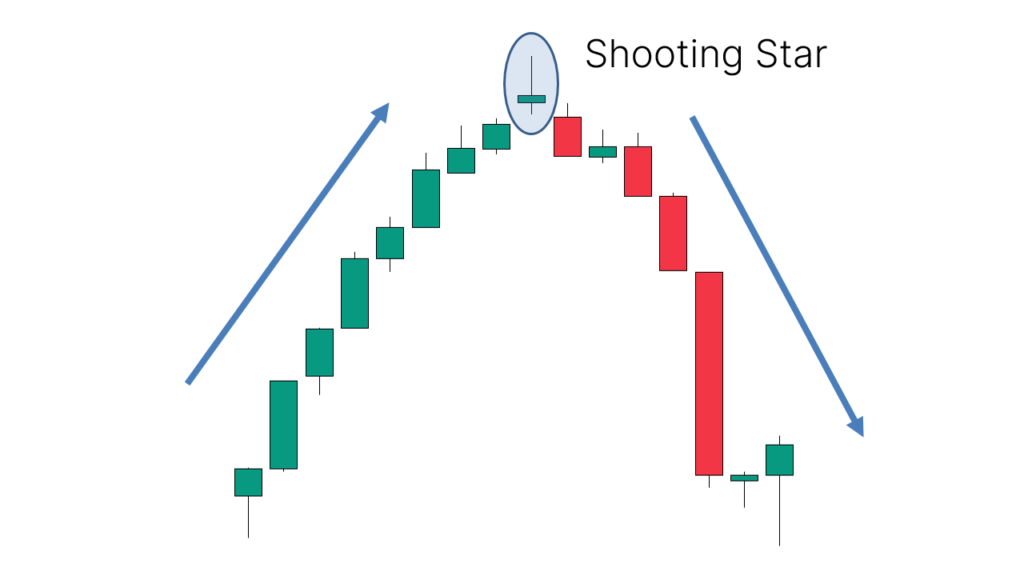
At the conclusion of an upward trend, the following chart displays a lovely shooting star.
This pattern’s creation signals the conclusion of the upward trend and the start of a new downward trend.
Technical indicators, supply and demand zones, and support and resistance can all be used with this candlestick pattern.
The shooting star is one of the most effective signals I use to enter the market since it is incredibly profitable and easy to spot.
I will go into more depth about it and walk you through the process of making money trading this price action pattern in the upcoming chapters.
The Harami Pattern (the inside bar)
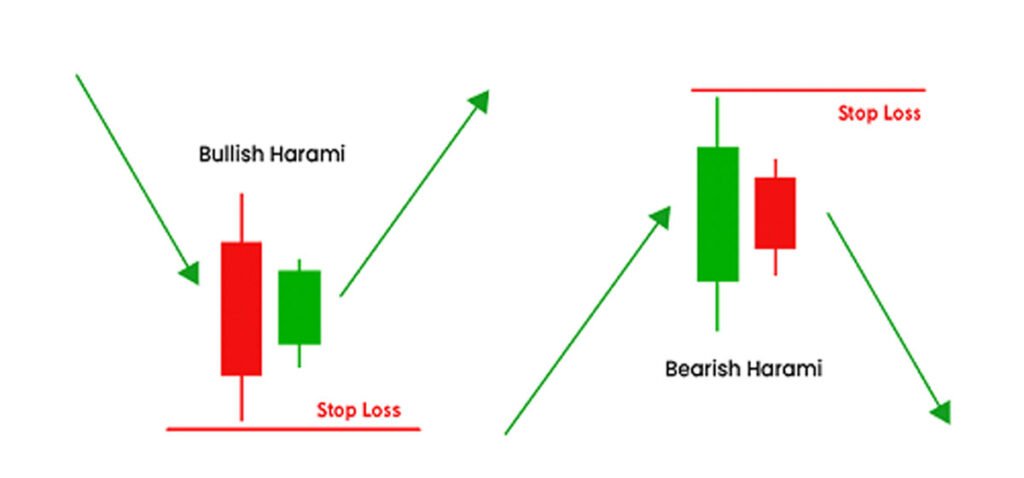
Do not worry about the colors; what matters most is that the smaller body closes inside the first, larger candle. As you can see, the tiny body is completely covered by the previous mother candle.
The market is currently experiencing indecision, according to the Harami candle.
The market is consolidating, to put it another way.
As a result, neither buyers nor sellers are sure what to do, and the market is uncontrolled.
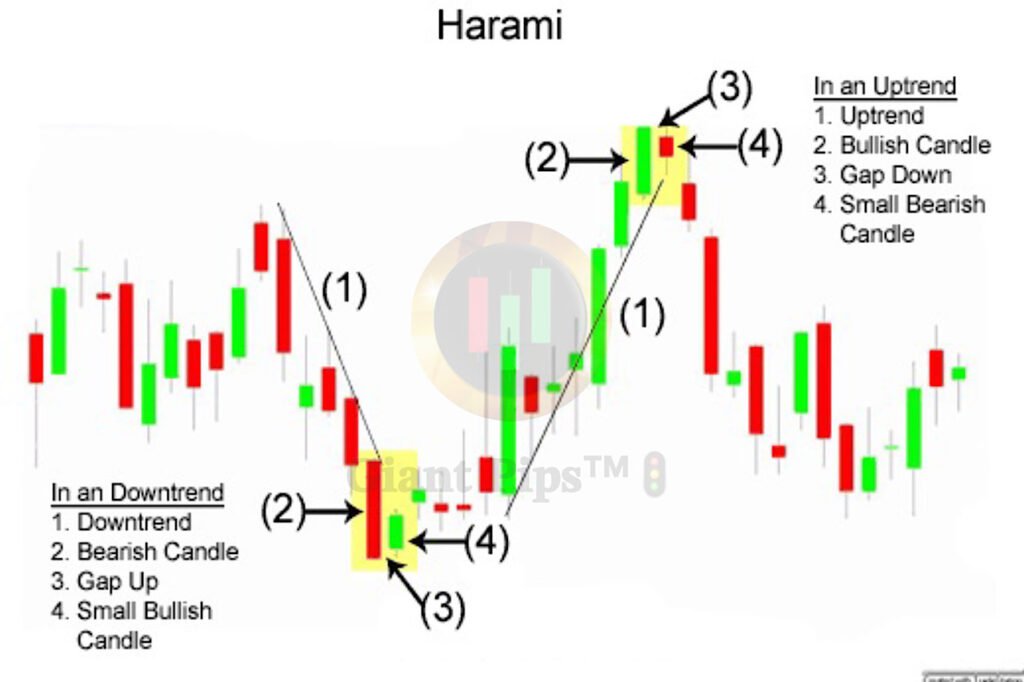
This candlestick pattern is seen as a continuation pattern that presents a favorable opportunity to enter the trend when it occurs during an upswing or a downtrend.
Additionally, it is seen as a trend whether it happens at the peak of an upward trend or at the bottom of a downward trend.
The Tweezers tops and bottoms
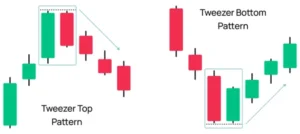
The Tweezer Top pattern is a bearish reversal signal that appears at the peak of an uptrend, while the Tweezer Bottom pattern is a bullish reversal signal found at the bottom of a downtrend. See the example below:
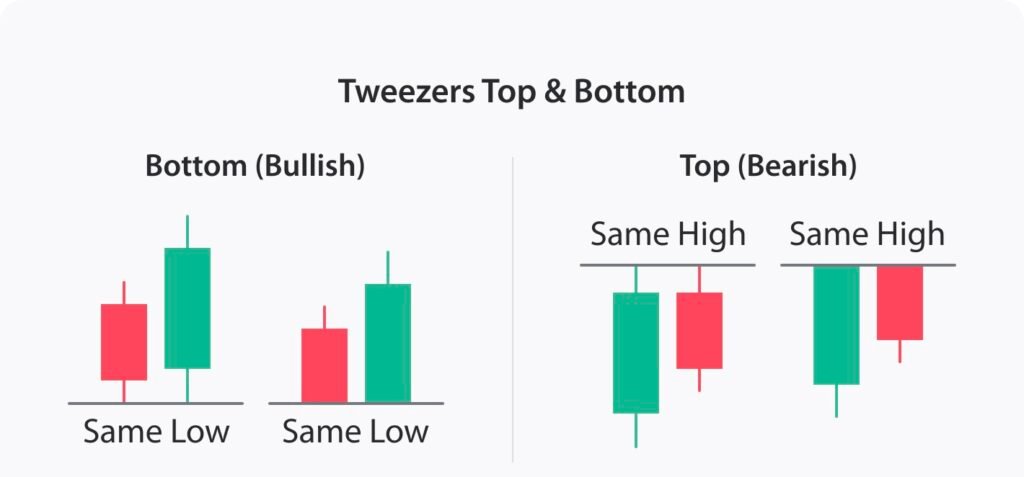
The Tweezer Top formation consists of two candlesticks: a bullish candlestick followed by a bearish one. Similarly, the Tweezer Bottom formation also has two candlesticks, but in this case, the first is bearish, followed by a bullish candlestick, making it the bullish counterpart to the Tweezer Top.
The Tweezer Top occurs in an uptrend when buyers push prices higher, creating the appearance of continued upward momentum. However, sellers then step in, pushing the market lower and closing below the bullish candle’s open, signaling a potential trend reversal. This bearish reversal can be a strong trading signal when combined with other technical tools.
The Tweezer Bottom forms in a downtrend when sellers drive prices lower, but the next session closes above, or at roughly the same level as, the previous bearish candle. This suggests that buyers are gaining control, potentially reversing the trend. If this pattern appears near a support level, it often signals an impending bullish reversal.

The chart above illustrates a Tweezer Bottom pattern forming in a downtrend. Initially, bears pushed the market lower during the first session. However, the second session opened at the prior close and moved upward, signaling a potential reversal and buy opportunity—especially when supported by other confirming factors.
Rather than focusing solely on candlestick names, it’s crucial to understand the psychology driving these formations, as that insight is key to interpreting market direction effectively.
Because if you can understand why it was formed, you will understand what happened in the market, and you can easily predict the future movement of price.

