Market structure is so important, so as a trader, one of the most crucial skills you can develop is reading it. This skill enables you to apply the right price action strategies based on the current market condition. Not all markets are traded the same way; understanding market movement and trader behavior is essential.
Market structure is essentially the study of how markets behave. By mastering it, you’ll be able to open your chart and answer key questions, such as: What is the crowd doing? Who holds control—buyers or sellers? When and where should you enter or exit, or when is it best to stay out entirely?
In your price action analysis, you’ll encounter three primary market types: trending, ranging, and choppy. This chapter will guide you in recognizing each market type and understanding how to trade accordingly.
Discover Giant Hunter AI

Trending markets
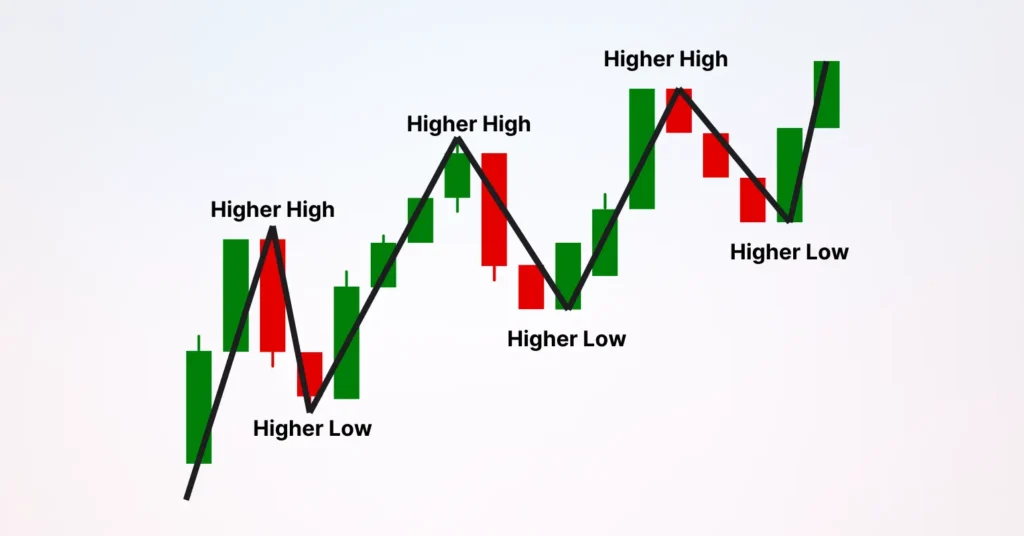
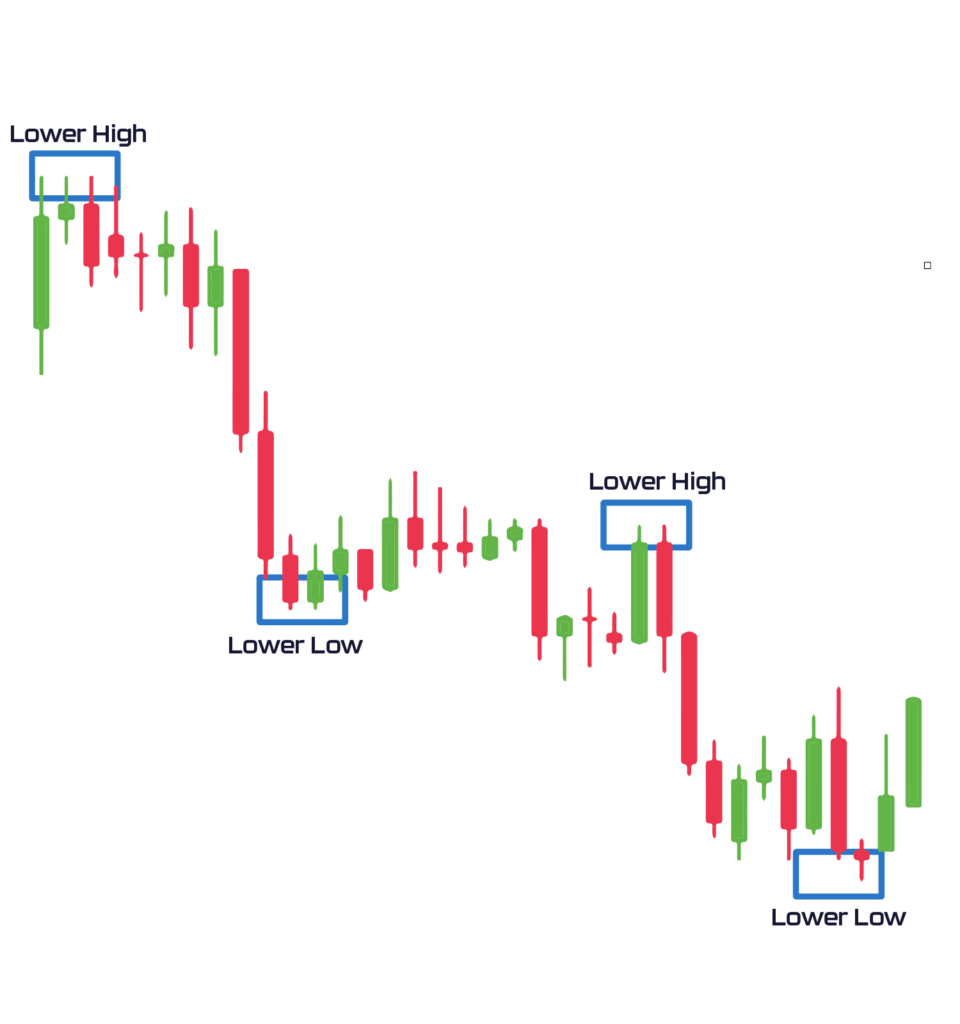
Trending markets are identified by a consistent pattern: in an uptrend, prices form higher highs and higher lows, while in a downtrend, they create lower highs and lower lows. See the example below:

In the example above, the market consistently forms higher highs and higher lows, signaling an uptrend. No indicators are needed to determine if the market is bullish or bearish—a simple visual check of price action gives a clear sense of the trend. Now, see another example of a downtrending market.

The example above highlights a bearish market with a clear pattern of lower highs and lower lows, signaling a strong downtrend. Identifying trending markets is straightforward—avoid overcomplicating your analysis. If the market shows a pattern of higher highs and higher lows, it’s an uptrend; if it shows lower highs and lower lows, it’s a downtrend.
Statistics suggest trends appear about 30% of the time, so it’s essential to recognize and capitalize on them. To accurately identify trends, focus on larger timeframes like the 4-hour, daily, or weekly charts, as smaller timeframes are less reliable for assessing market structure. Discover Giant Hunter AI

How to trade trending markets:
Once you can identify a trend, trading becomes easier. In a bullish market, focus on finding buying opportunities, as trading with the trend increases your chances of success. Conversely, in a bearish market, look for selling opportunities.
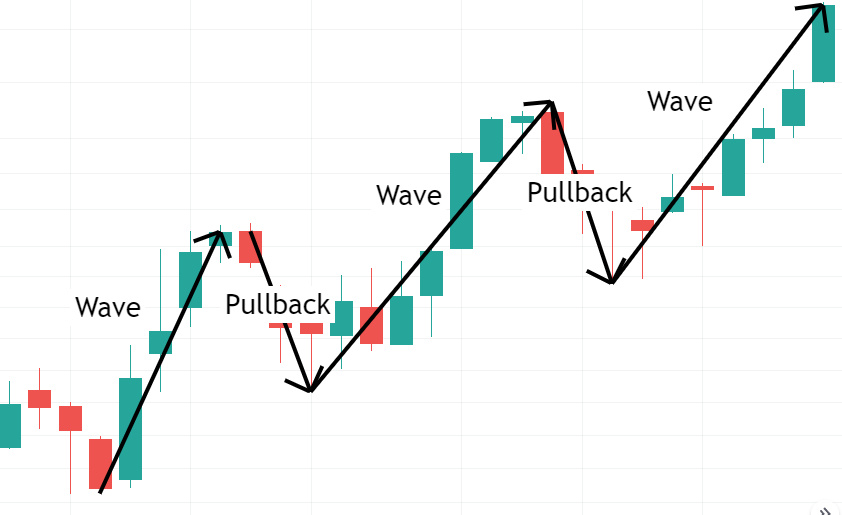
But when is the right time to enter a trending market? Trending markets consist of two key movements: the impulsive move and the retracement move. See the example below to get a better understanding.

In the example, the market consistently makes higher highs and higher lows, signaling a bullish trend. In such a market, buying opportunities are the priority. However, as shown, the market alternates between two types of moves: an impulsive move and a pullback, or retracement (corrective move).
Professional traders leverage this pattern by entering positions at the start of an impulsive move and exiting at its peak. This cyclical movement—an impulsive move in the trend’s direction followed by a retracement—defines trending markets.
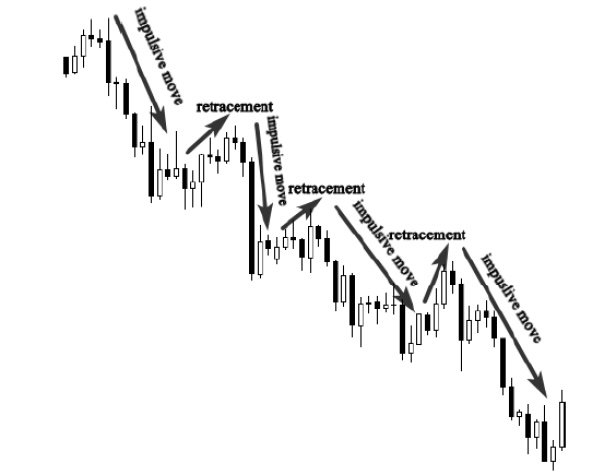
Understanding this flow helps you identify optimal entry points. Buying at the start of an impulsive move rather than during a retracement prevents getting caught by stop-loss triggers before the market resumes its trend. See the example below of a bearish trend.
Downtrend Scenario

The illustration above shows a downtrend market, where the ideal trading decision is to sell at the start of an impulsive move. Attempting to sell during the retracement phase could lead you to get trapped by professional traders and result in a losing trade.
Now that we know how to identify both uptrends and downtrends, as well as distinguish between impulsive and retracement moves, it’s important to understand how to spot the beginning of an impulsive move. This is the key to entering the market at the right time, alongside professional traders, and avoiding being caught by retracement moves.
To predict the start of an impulsive move in a trending market, you must become proficient at drawing support and resistance levels. In the next chapter, we will explore what support and resistance levels are and how to draw them on your charts.
Discover Giant Hunter AI

