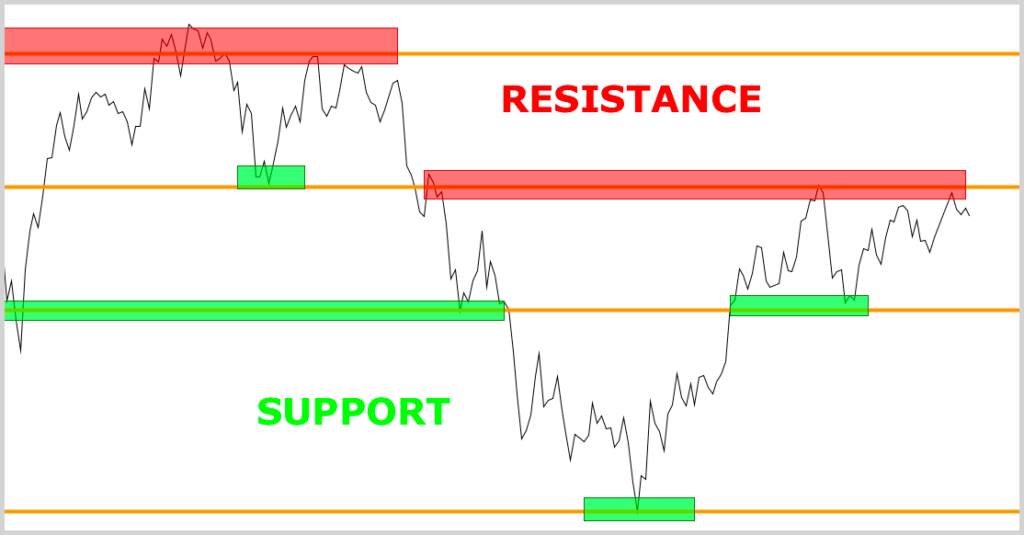
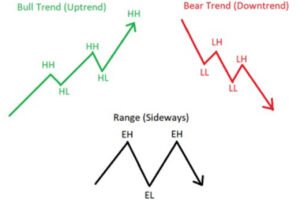
Support and resistance are key levels in the market where buying and selling balance out, often marking turning points.
These levels form when price changes direction, containing movement until a breakout occurs. In trending markets, they appear at swing points: in an uptrend, previous lows become support, while in a downtrend, previous highs act as resistance.
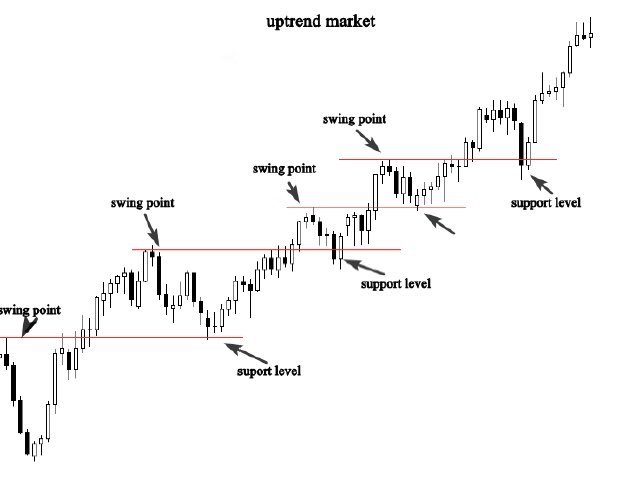
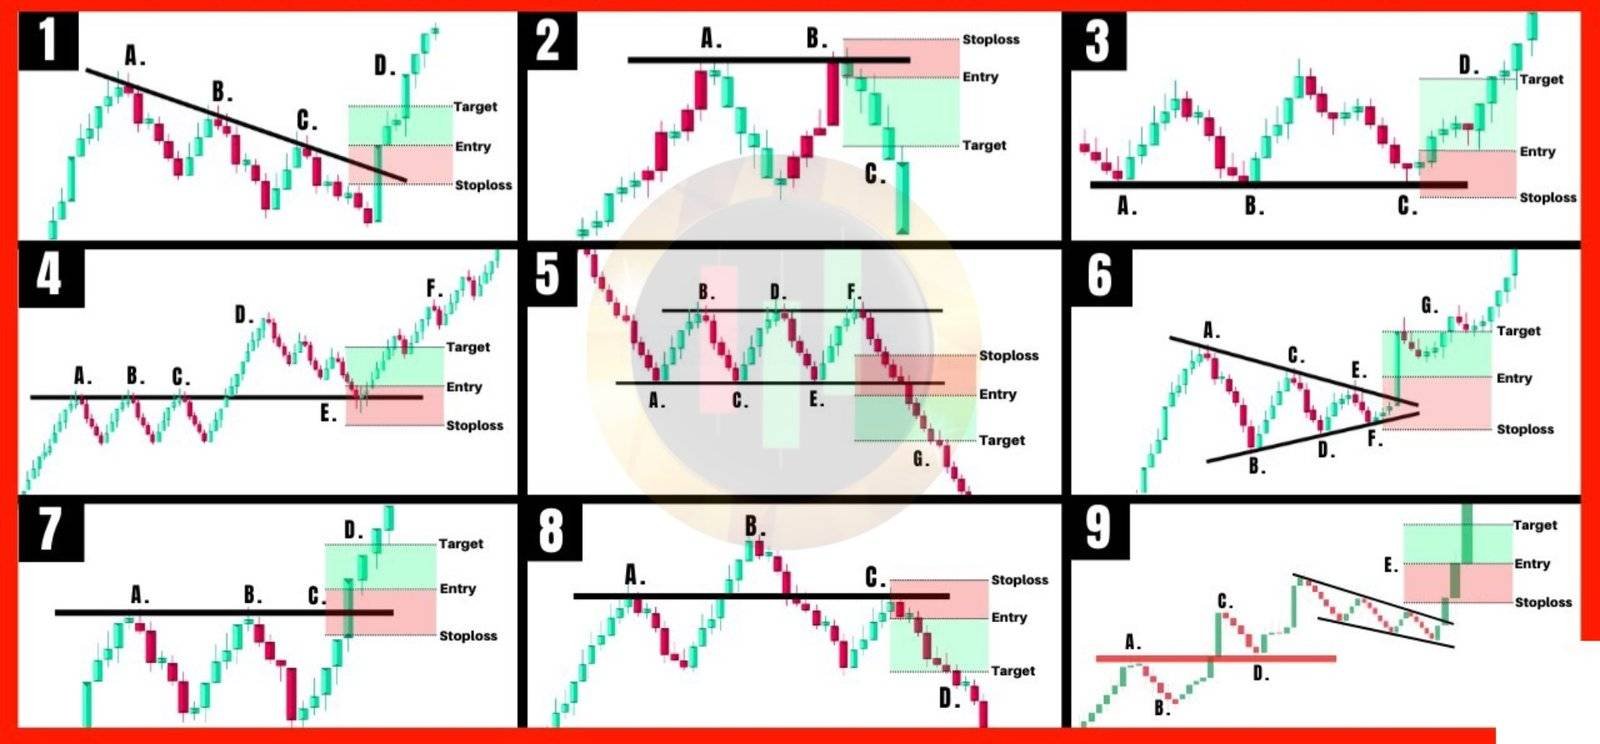
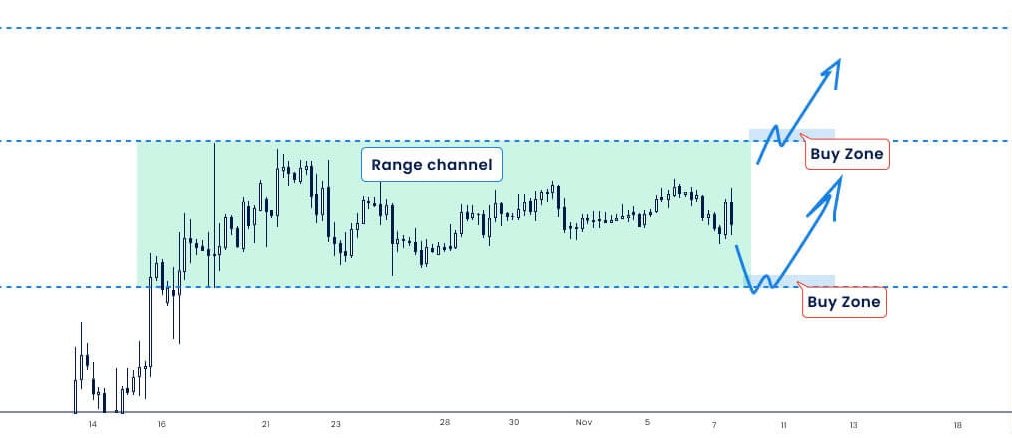
The illustration above demonstrates how, after a breakout, a previous swing point can act as a support level. When the market retraces, it often respects this support level, signaling the start of another upward movement.
Discover Giant Hunter AI
Observing this test of the previous support level allows traders to anticipate the next impulsive move in an uptrend. Similarly, in a downtrend, previous swing points act as resistance levels, helping traders forecast future moves.
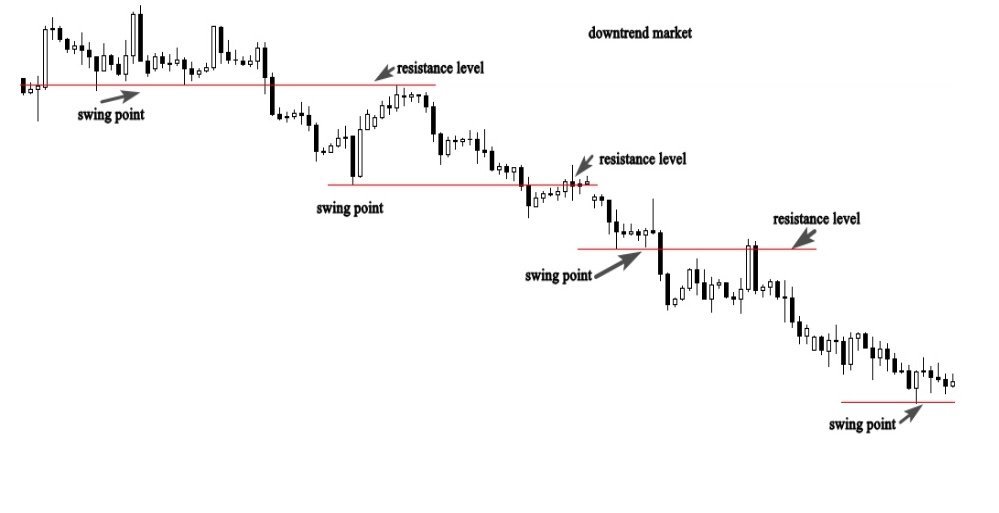
The illustration above shows us how the market respects resistance levels when prices approach the previous swing point (resistance level).
In a trending market, understanding price action can help you accurately predict the next impulsive move.
Drawing trend lines is another useful technique to identify key support and resistance levels. Trend lines represent linear levels that the price often respects as it forms new swing highs and lows.
In a bullish market, trend lines typically create a support level, while in a bearish market, they form resistance.

