Trading tactics are so important to all traders. When identifying the trend (uptrend or downtrend) and key levels (support or resistance) and finding a pin bar near these levels that aligns with the trend direction, the next step is determining how to enter the market based on the candlestick pattern.
From my experience, there are several entry options for trading pin bars, which depend on the candle’s anatomy, market conditions, and your money management strategy.
- The Aggressive Entry Option: This method involves entering the market immediately after the pin bar closes, without waiting for additional confirmation. This strategy allows you to catch the move early, as sometimes the price moves higher right after the pin bar closes. If you don’t enter at this point, the trade may pass by without you.
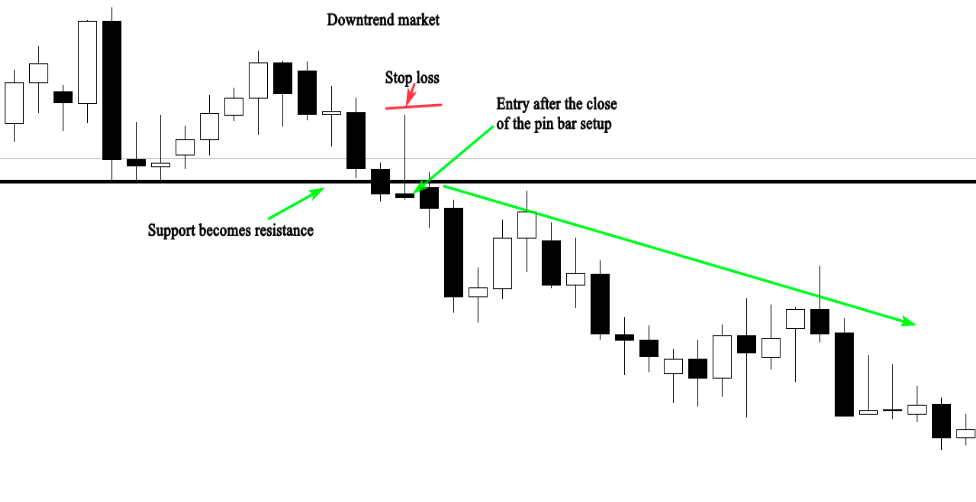
The chart above demonstrates how an aggressive entry can help you execute your trade at the right time, ensuring you’re not left behind by the market. In this example, the trade was based on three key elements:
- The Trend: The market was in a downtrend, so we focused on selling opportunities.
- The Level: A support level was turned into resistance, providing a strong area for potential price rejection.
- The Signal: A clear pin bar formed after a retracement to the resistance level.
When all three elements align, you can enter the market right after the pin bar closes, placing your stop loss above the long tail. Your profit target will be the next support level in a downtrend.
These three components are enough to find high-probability entries.
The Conservative Entry Option: This strategy involves waiting until 50% of the range of the pin bar’s retracement is completed before entering the market. While this strategy can sometimes provide a favorable risk/reward ratio (more than 5:1), there are times when the market may move without you.
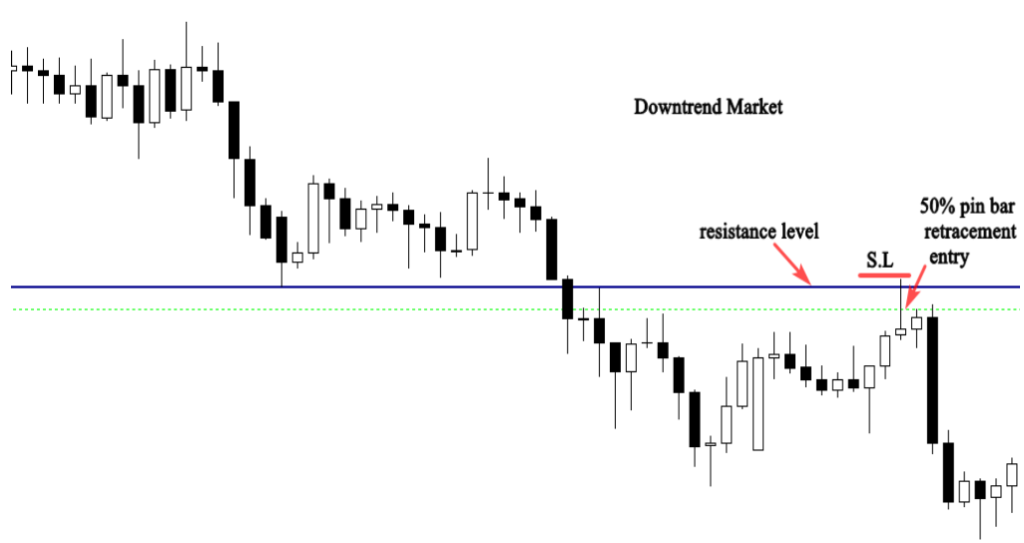
The illustration above highlights the strength of conservative entries. As shown, this entry method helps reduce risk while increasing the potential reward. In the example, the trade offers a risk/reward ratio of more than 5:1, meaning a single trade like this each month can generate a solid income.
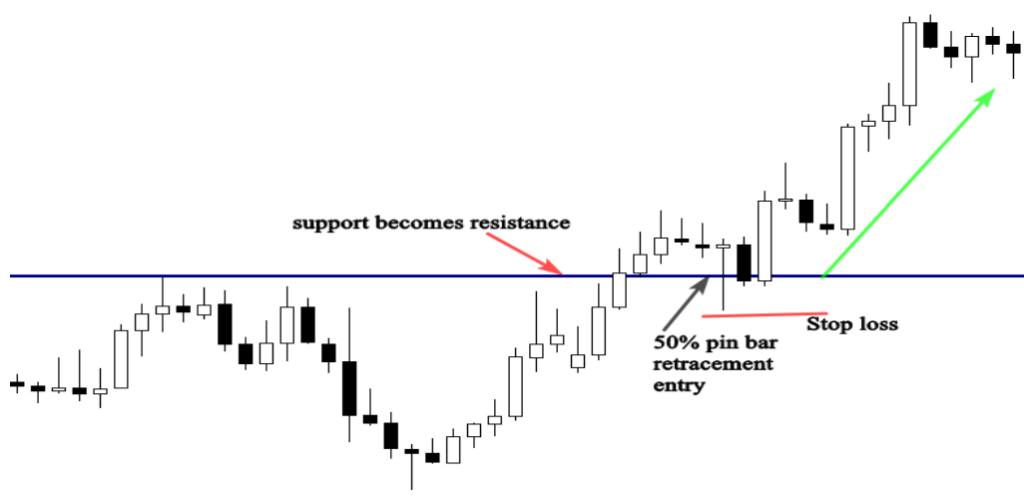
One drawback of the conservative entry option is that sometimes the market won’t retrace to 50% of the range bar, causing frustration as the price moves toward the profit target without you.
There is no definitive “right” or “wrong” entry method; both aggressive and conservative strategies can be effective. With more screen time and experience, you’ll be able to judge when to trade aggressively or conservatively based on the market conditions.
Discover Giant Hunter AI

Trading pin bars with confluence
Confluence occurs when multiple technical indicators generate the same signal. This concept is essential for price action traders as it helps filter entry points and identify high-probability setups in the market.
Whether you’re a beginner or an advanced trader, using confluence is crucial. It allows you to focus on quality setups instead of chasing quantity, significantly improving your trading performance.
Confluence refers to the combination or conjunction of factors, where two or more elements come together. For instance, when looking for a pin bar signal, it’s important to find additional factors of confluence to confirm your entry. You shouldn’t act on every pin bar you see on your chart, but rather on those that align with other confirming factors.
Factors of confluence:
The Trend: This is one of the most crucial elements of confluence. Successful traders always start by identifying the trend on their charts. You can’t trade any setup without ensuring it aligns with the market’s direction. For example, a bearish pin bar in a downtrend is a much stronger signal than one in a range-bound market.
Support and Resistance Levels & Supply and Demand Areas: These key levels hold significant importance because major market participants monitor them closely. Reactions around these levels can provide strong confirmation for trades.
Moving Averages: Personally, I use the 8 and 21-period moving averages. These moving averages act as dynamic support and resistance levels, and they are essential factors of confluence in trending markets.
Fibonacci Retracement Tool: I rely on the 61% and 50% Fibonacci retracement levels to identify the most powerful areas in the market. These retracement levels help pinpoint key zones where price reversals are more likely to occur.
Trend Lines: Drawing trend lines on your charts helps identify the market’s direction and highlights key reversal points. They are an important tool for recognizing the flow of price movement and spotting potential turning points.
When analyzing your chart, you don’t need to identify all the confluence factors to validate a trade. Even finding just one or two factors of confluence alongside a strong pin bar setup is enough to make a profitable trade.
For example, a clear pin bar signal near a support or resistance level, in line with the market’s direction, can be a high-probability setup.
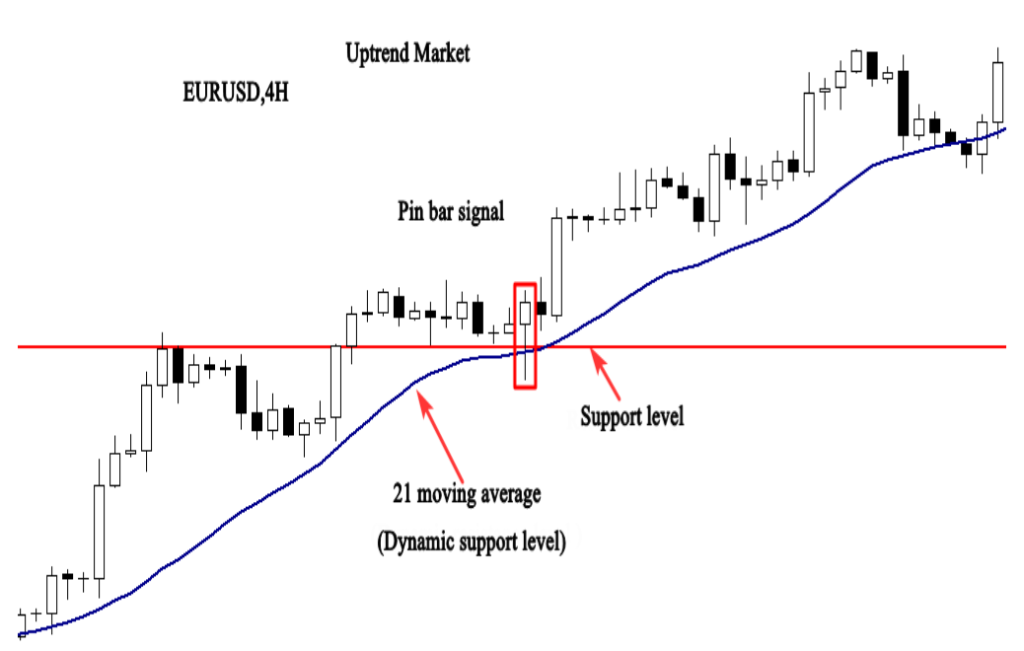
In the example above, we have a high-probability setup with four factors of confluence:
- The Trend: The market is in an uptrend, so we focus on looking for buying opportunities.
- The Level: The support level is a key area in the market. In this case, the price broke through the resistance level, which then became support, and pulled back to it.
- The Signal: A bullish pin bar formed after the retracement back to the former resistance level now acting as support.
- Another Signal: The rejection of the pin bar from the support level, along with the 21-period moving average acting as dynamic support.
These factors combined create a strong signal to buy the market.
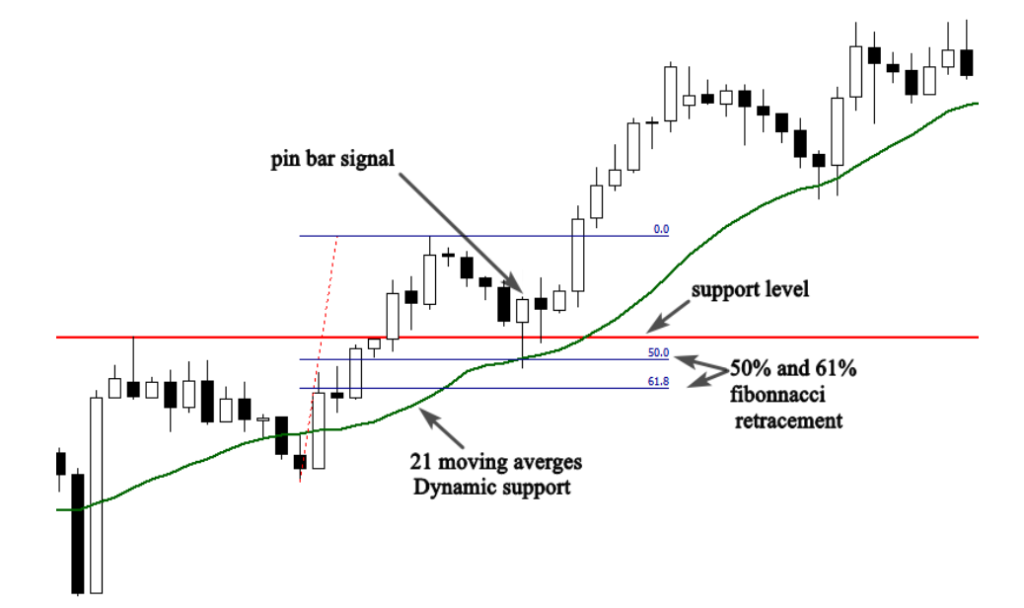
The example below demonstrates four levels of confluence that create a powerful trading signal:
- The Trend: The market is in a bullish trend, which indicates buying opportunities.
- The Level: A resistance level has turned into support.
- The 21-Moving Average: It is acting as a dynamic support level.
- The Pin Bar: A pin bar forms near these levels, in line with the bullish trend.
By adopting this trading concept, you’ll change your approach to the market. You’ll start trading with precision, waiting for the best setups to come to you rather than forcing trades to happen. This will help you trade with a sniper-like focus, improving your overall strategy.
Discover Giant Hunter AI

Pin Bars trades examples
I’ll help you analyze how to trade the pin bar candlestick pattern with the trend and use confluence to confirm the entries.
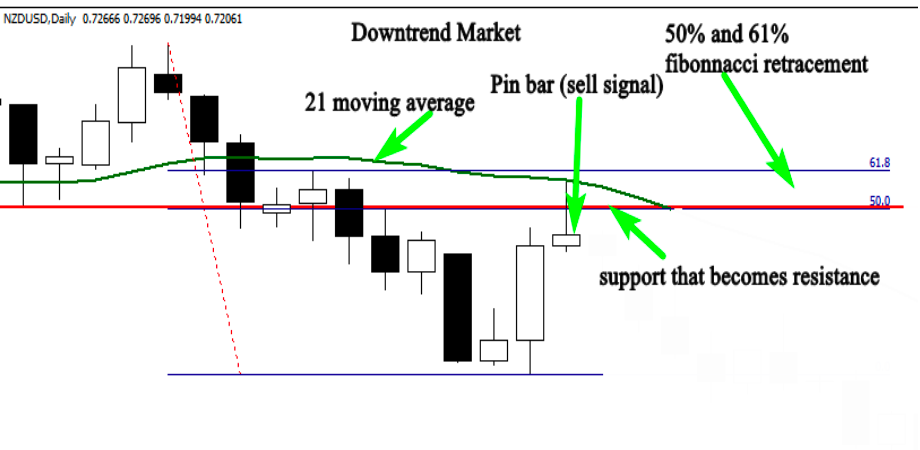
In this NZDUSD daily chart example, here’s how the confluence concept and the pin bar candlestick pattern work together to create a high-probability trade:
- The Trend: The market is in a downtrend, providing the first confirmation that we should be looking for selling opportunities.
- The Resistance Level: After the breakout of the support level, it turned into resistance. The price retraced back to this level and formed a pin bar candlestick, which suggests the retracement is over and an impulsive move to the downside is likely.
- The 21-Moving Average: Adding the 21-moving average, we see that the pin bar is rejected from this dynamic resistance, confirming the bearish sentiment.
- The Fibonacci Retracement: The pin bar is also rejected from the 50% Fibonacci retracement level, which is a powerful key level. This adds further confidence that the market is likely to continue lower.
With all these factors combined—downtrend, pin bar at resistance, rejection from the 21-moving average, and rejection from the 50% Fibonacci retracement—this provides solid reasons to sell the market.
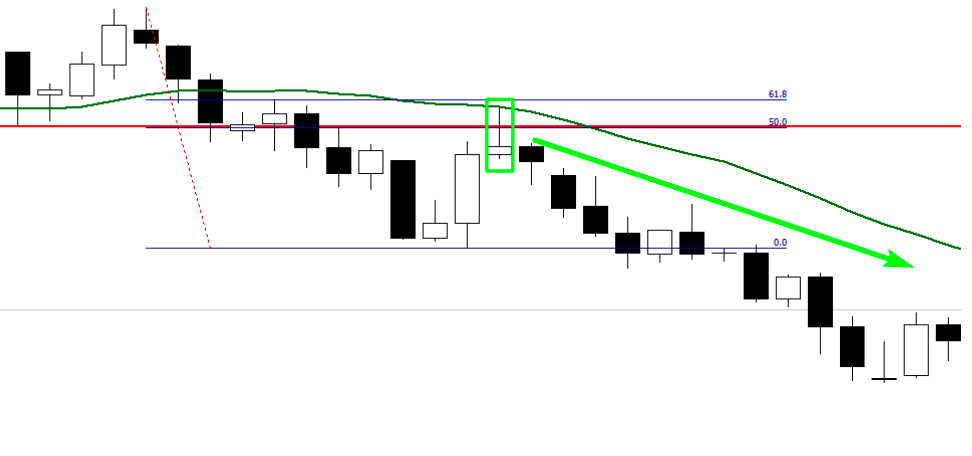
Our research was correct since it was founded on sound justifications for entering the market, as the preceding figure illustrates.
I want you to master this strategy so that you can trade the market profitably. Below, have a look at another chart:
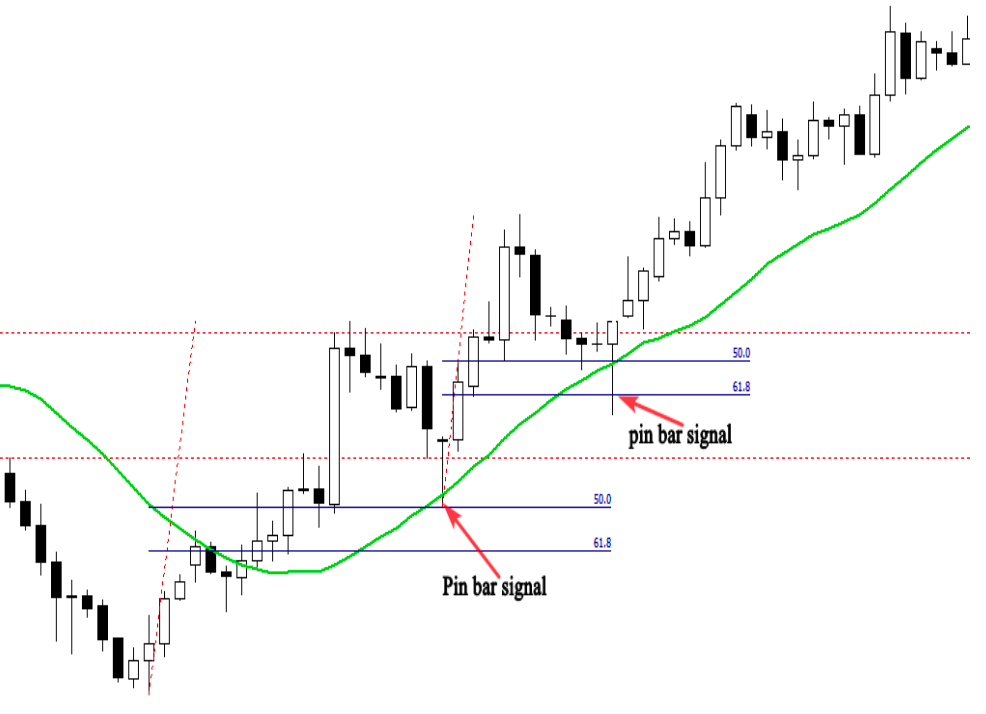
Two significant purchasing opportunities are depicted in the above graphic.
Since the market was rising, it was quite likely that the first pin bar would develop following the pullback back to the support level.
The 50% Fibonacci retracement and the rejection from the 21-moving average validate our entry.
The second pin bar, which enabled us to reenter the market and increase our gains, experiences the same thing.
Discover Giant Hunter AI

Trading pin bars in range-bound markets
When prices begin trading horizontally between a defined level of support and a defined level of resistance without making any higher highs or lows, we can say that the market is ranging.
I have to adjust my trading approach to suit the changing market conditions as soon as I see that the market is acting differently.
It is very easy to trade a ranging market by going long when prices reach the support level and going short when prices approach the resistance level. To confirm a ranging market, I need to look for at least two touches of the support level and two touches of the resistance level.
Here is an illustration of a range-bound market:

As you can see, we have the chance to buy or sell the market when prices get closer to the important support or resistance level; all we have to do is wait for a pin bar candlestick or other clear price action setup.
Examine the following illustration:
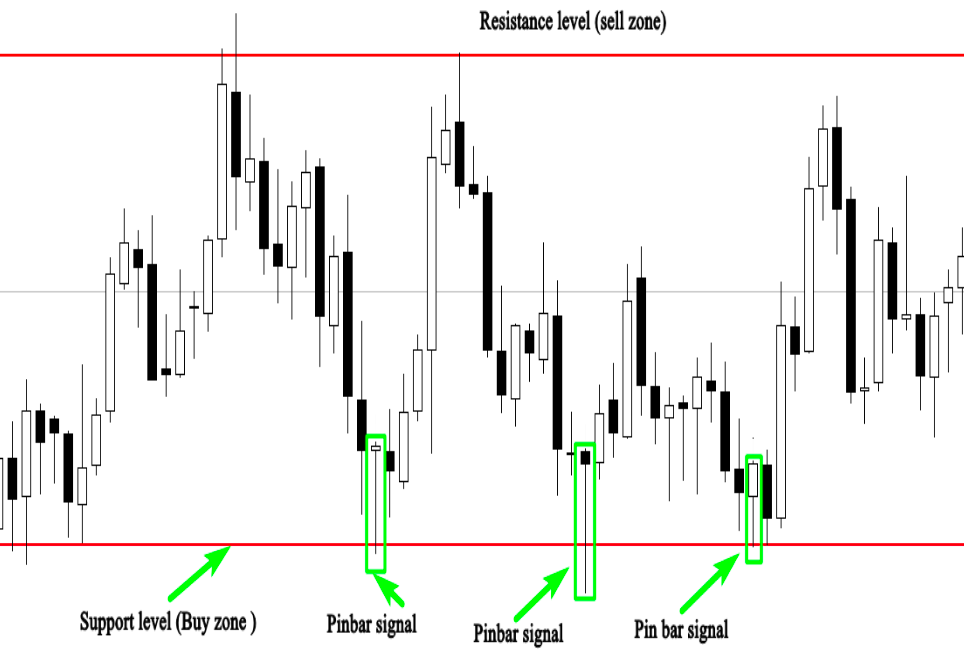
I will walk you through how to trade the three trading chances in the above illustration:
- The first one is a pin bar that has been rejected from the support level; you may either wait for the market to reach 50% of the pin bar range or place a buy order once the pin bar closes.
Place your profit objective close to the resistance level and your stop loss above the support level.
The trade’s risk-reward ratio is quite alluring. - You put a buy order after the pin bar closes, and your stop loss should be below the support level, as the second trading opportunity is close to the support level. Next resistance level is your profit target.
- The third setup is a clear buying opportunity; as you can see, the market created a pin bar after being rejected from the support level, indicating that buyers are still present and that a bounce from the support level is likely.
The simplest strategy to profit from range-bounds trading is to trade from significant critical support and resistance levels; never attempt to trade any setup if it is not forcefully rejected from these areas.
The second approach involves either trading in the direction of big key level breakouts or waiting for the prices to return to the breakout point before deciding whether to short or go long in the market.
View the following example:

The price broke out of the support level and returned to the breakout point in the above figure, which shows a range-bound market. The construction of an obvious pin bar also suggests a high probability signal to short the market.
Professional traders use this price movement indicator to trade a variety of markets.
Discover Giant Hunter AI

How to confirm pin bar signals using technical indicators
Your chances of making a profit will increase if you use technical indicators to validate your entries. I am not saying you should only use indicators to generate signals—that will not ever work for you—but if you can pair the appropriate indicators with your price action strategies, you will be able to filter your signals and trade the best setups.
The Bollinger bands indicator is among the best tools I employ to validate my entries while analyzing a range-bound market.
John Bollinger created this technical trading method to gauge the volatility of a market.
The approach is straightforward: if prices are rejected from the bands and major critical levels, it is a sign that the market will recover from these levels. We will combine horizontal support and resistance with the upper and lower Bollinger bands fake breakout.
Below is an example:
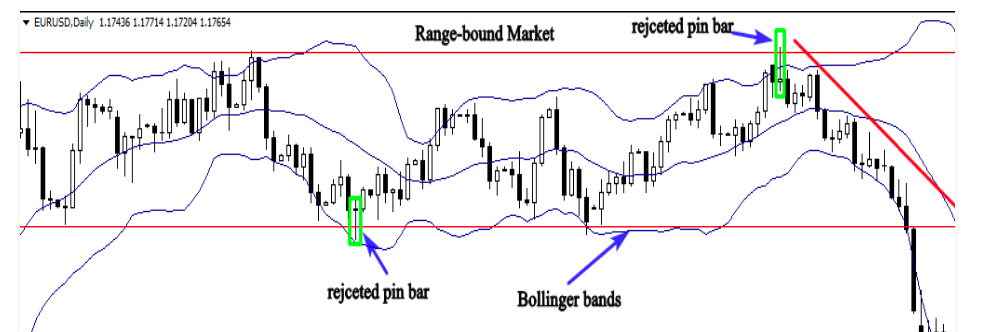
As you can see from the accompanying chart, the Bollinger bands serve as dynamic support and resistance; prices bounce sharply when the market gets close to either the upper or lower bands.
Therefore, it is obvious that we should buy or sell the market if we observe that a pin bar is rejected from both bands and a horizontal key level.
Since trading is all about emotions, this straightforward confirmation approach can assist you in deciding whether to accept a trade or reject it.
In a range-bound market, you may occasionally see a good pin bar signal, but you will struggle to decide whether to act on it.
In this situation, all you need to do is place your Bollinger bands on your chart. If you notice that the signal is rejected by both the bands and the horizontal levels, do not overthink your next course of action.
Simply execute your trade, set your profit objective, and stop the loss, then step back and let the market take care of the rest.
Below is another example:
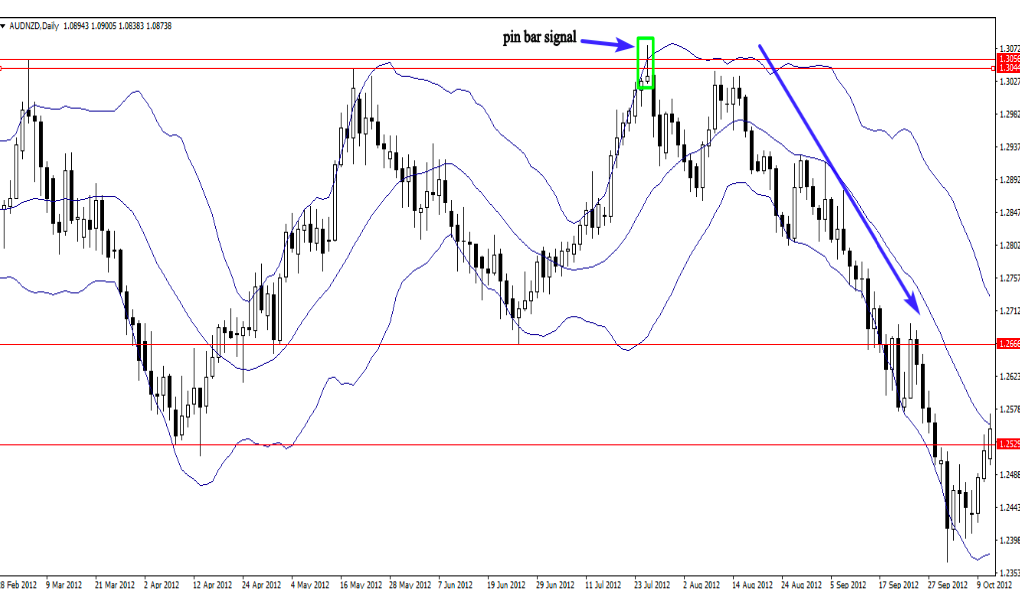
The daily chart above demonstrates how this indicator might provide us with the confidence to execute our trades; the pin bar’s erroneous breakthrough of the resistance level was a strong indication to short the market. The false breakout of the upper band further supported the trade.
To understand how this technique will improve your trading account, keep in mind that this technical indicator is only meant to be used as a confirmation tool in range-bound markets; it should never be used to generate signals.
Instead, it should only be utilized in conjunction with horizontal key levels.
Finally, before opening and funding your trading account, I advise you to put these tactics into as much practice as possible.
Discover Giant Hunter AI

