Ranging markets, often referred to as sideways markets, are characterized by price movements that appear to move horizontally. In these markets, the price fluctuates within a set range without making consistent upward or downward progress.
When the market forms a series of higher highs and higher lows, it’s typically in an uptrend. However, when this pattern stops and price fails to create new peaks, the market is considered to be in a range-bound phase.
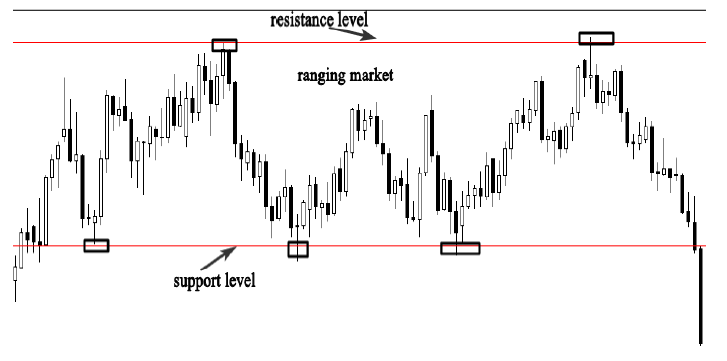
In a ranging market, price repeatedly bounces between support and resistance levels, as buyers and sellers push the price back and forth within these boundaries.
This type of market often reflects a period of consolidation before a breakout or a shift in trend. Here’s an example to illustrate:

The chart above illustrates a ranging market, where the price fluctuates between horizontal support and resistance levels.
In contrast to trending markets, which form a series of higher highs and higher lows during an uptrend or lower highs and lower lows in a downtrend, ranging markets lack this consistent upward or downward movement. Instead, the price bounces back and forth between established support and resistance levels, indicating a period of consolidation or indecision in the market.
Ranging markets typically move horizontally between key support and resistance levels, with price oscillating between these boundaries.
Understanding the distinction between trending and ranging markets is crucial for applying the correct price action strategies based on the current market conditions.Discover Giant Hunter AI

Trading in a ranging market differs significantly from trading in a trending market. In a range-bound market, the forces of buyers and sellers are in equilibrium, meaning neither side has control. This balance persists until the price breaks out of the range and the market transitions into a trending phase.
The most favorable buying and selling opportunities in ranging markets occur at key support and resistance levels.
There are three main approaches to trading in a ranging market, but the key takeaway here is developing the ability to recognize whether the market is trending or ranging when you look at your charts. In future chapters, we’ll delve deeper into the specific tactics and strategies you can use for both trending and ranging markets.
If you’re unable to distinguish between a ranging market and a trending market, you’ll struggle to apply price action strategies effectively. One simple method for trading a range-bound market is to wait for price to approach support or resistance levels—buy near support and sell near resistance.
Giantpipsadmin
Stay tuned for detailed strategies in the upcoming chapters. Here’s an example below:

As observed, the market is moving horizontally, and in such conditions, the best buying opportunities occur at the support level, while the best selling opportunities arise at the resistance level.
Another way to trade ranging markets is by waiting for a breakout from either the support or resistance level. In a ranging market, there’s uncertainty—no one knows who will take control. Buyers and sellers are in balance, but when one side gains control, it leads to a breakout from the established range.
A breakout signals the end of the ranging phase and the start of a new trend. This shift can provide new trading opportunities as the market transitions from sideways movement to trending conditions.
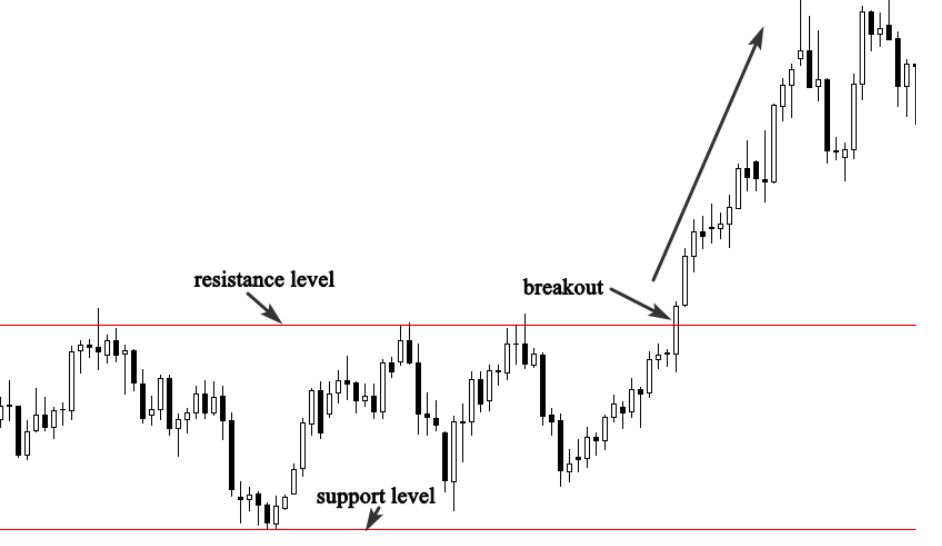
Keep an eye on the boundaries of the range, and when price breaks through either the support or resistance level, be prepared for the potential of a trending move. Here’s an example below:

As shown in the example, the market was previously trading between support and resistance levels, and then the price suddenly broke out above the resistance level. This breakout suggests that the market may be entering a new trending phase. The ideal entry point is typically after the breakout, as this confirms the trend’s direction.
However, it’s important to keep in mind that range boundaries are sometimes overshot, which can create a false impression of a breakout. This is often a deceptive move that traps traders who prematurely enter the market thinking the breakout is genuine. These fake breakouts can lead to unexpected reversals, so caution is necessary when trading breakouts.
The third method for trading ranging markets is to wait for a pullback after the breakout. Once the market breaks through support or resistance, the price often retraces slightly before continuing in the new trend direction. This pullback offers traders who missed the initial breakout a second opportunity to enter the market at a better price.
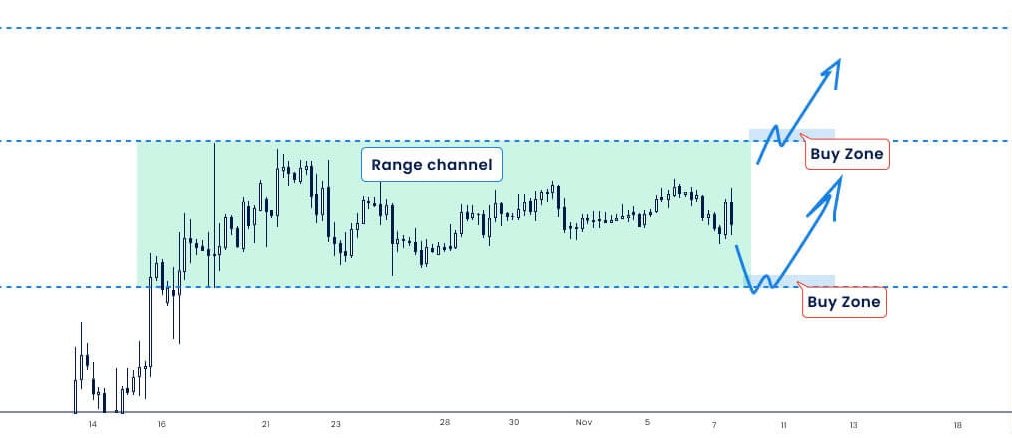
Here’s an example to illustrate this strategy:

As shown in the chart above, the market was initially ranging, but then price broke out above the resistance level, signaling the end of the ranging period and the start of a new trend. After the breakout, the market often retraces to retest the former resistance, which now acts as support, before continuing its upward movement.
This pullback provides a second chance for traders who missed the initial breakout to join the trend at a more favorable price. However, it’s important to note that pullbacks don’t always happen after every breakout. When they do occur, they present an excellent opportunity with a favorable risk-to-reward ratio.
Remember, in a ranging market, price moves horizontally between support and resistance levels, which are the key levels you should focus on. When the price breaks through either of these levels, it signals that the range-bound phase is over and a new trend may be starting. To trade this trend safely, always confirm that the breakout is legitimate before entering the market.
Discover Giant Hunter AI

If you miss the breakout, the next best opportunity is to wait for the pullback. When the pullback occurs, don’t hesitate to enter the market. This is a great chance to join the new trend with a better entry point.
When trading in ranging markets, it’s important to ensure that the market is suitable for trading. If you’re struggling to identify clear boundaries (support and resistance levels), this may be a sign that you’re looking at a choppy market.
In Forex, choppy markets are those with no clear direction. When you open your chart and notice a lot of noise—where it’s hard to determine if the market is trending or ranging—you’re likely in a choppy market. These markets can be frustrating and emotionally taxing, as they may lead you to question your trading strategies when your performance begins to drop.
To determine whether you’re in a choppy market, zoom out to a daily chart and look at the bigger picture. This broader view helps you assess the market’s overall direction. With experience and practice, you’ll become more adept at identifying choppy markets versus trending or ranging ones.
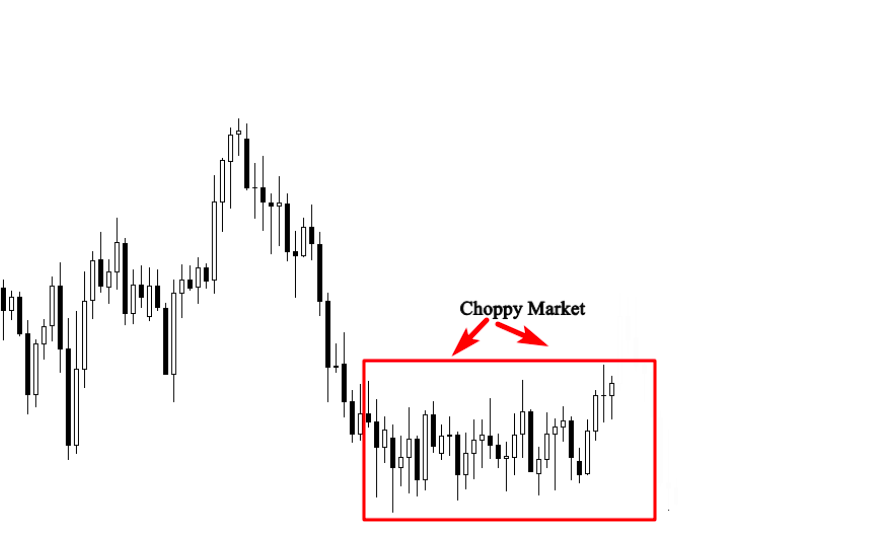
Here’s an example of a choppy chart that’s not ideal for trading:

As seen in the chart above, the price action in the highlighted area is very choppy, with the market moving sideways within a tight range. This is a clear indication of a choppy market, which you should avoid trading.
In my opinion, trading a choppy market is not worth the risk. If you attempt to trade in such conditions, you’re likely to give back your profits soon after making significant gains. This is because choppy markets often experience consolidation after sharp price movements, making it difficult to maintain consistent profits. It’s best to wait for clearer market conditions to ensure you’re trading with a stronger trend or range.
Discover Giant Hunter AI

