The engulfing bar candlestick pattern is one of the most effective and lucrative price action patterns; if you can use it correctly as an entry signal, your trading profitability will increase significantly.
If you are seeking a trading method that is far superior to what you have been doing, this section will teach you how to employ the engulfing bar pattern profitably, regardless of your level of experience. You have arrived at the ideal location.
What is an engulfing bar candlestick pattern pattern?
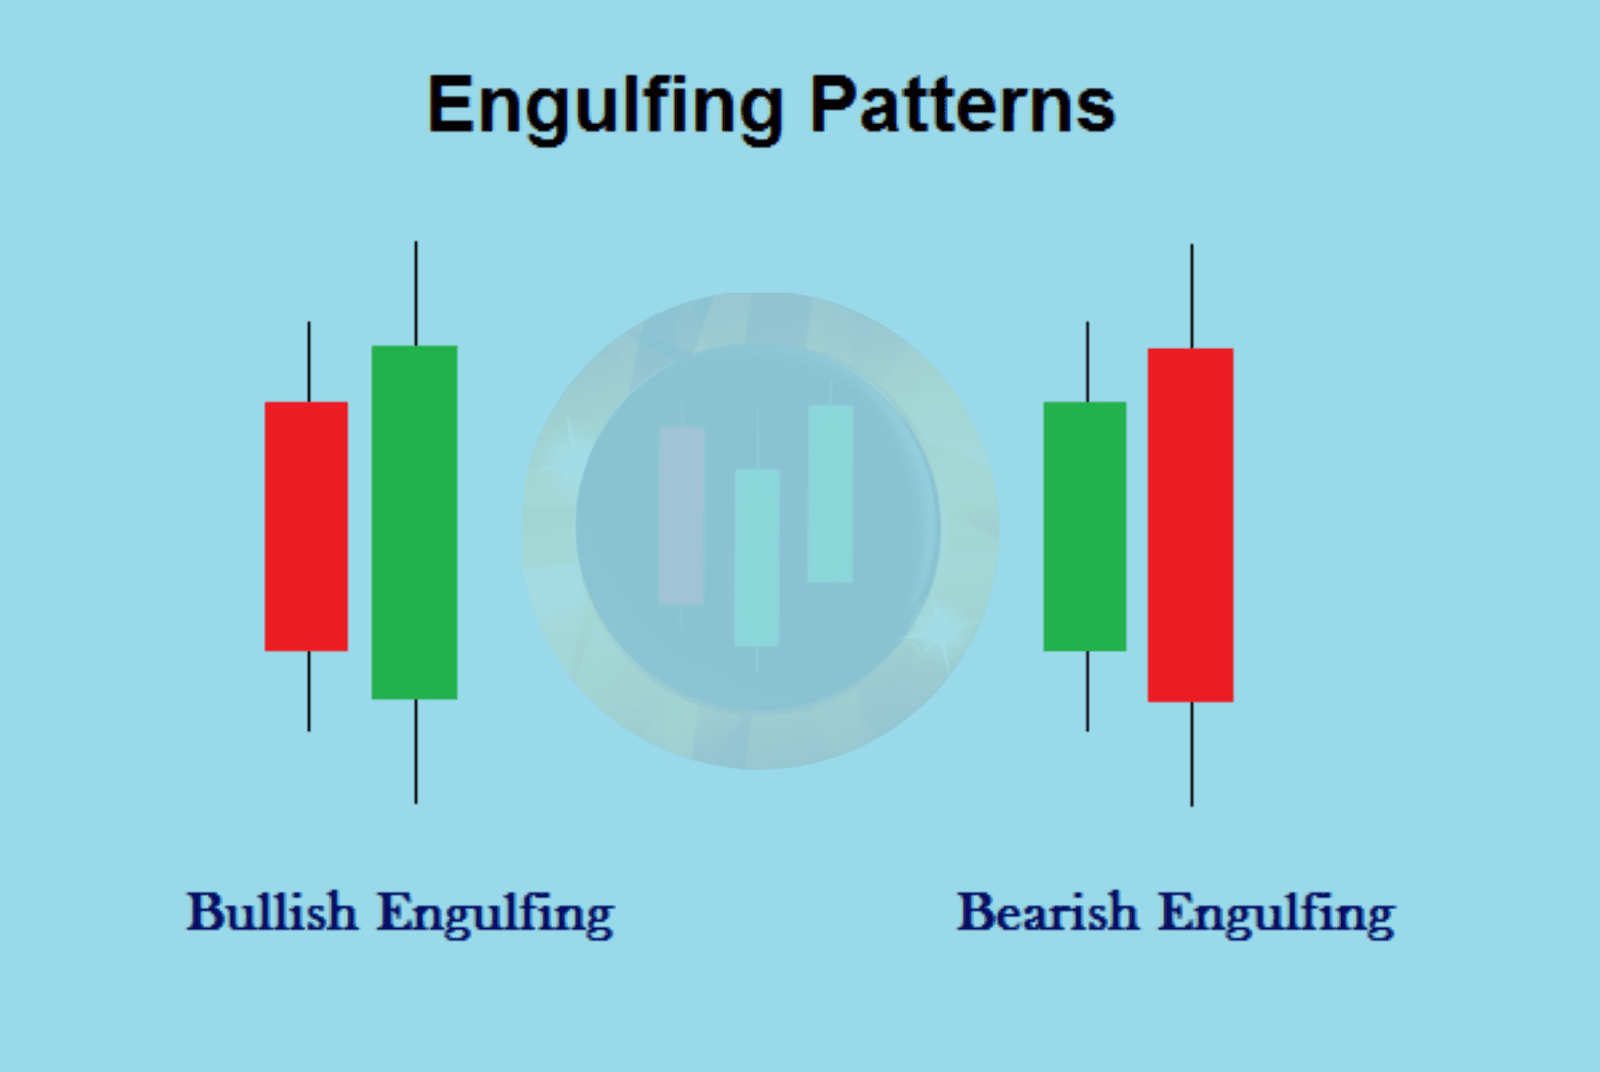
Two bodies of opposite colors make up this reverse candlestick pattern, with the second body completely enclosing or covering the first:

At the conclusion of a downward trend, a bullish engulfing pattern emerges, which indicates unequivocally that the purchasing pressure has surpassed the selling pressure.
The buyers are now involved, to put it another way.
An uptrend ends with a bearish engulfing pattern, which is a leading trend reversal indicator that indicates the bulls have lost control of the market and that a price trend reversal is inevitable.
View the following illustrations:
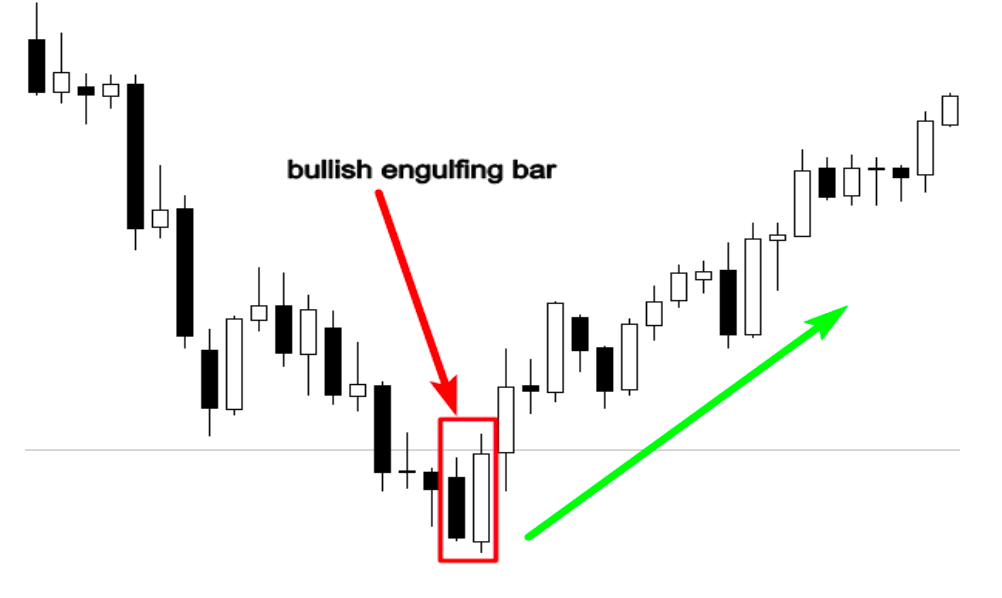
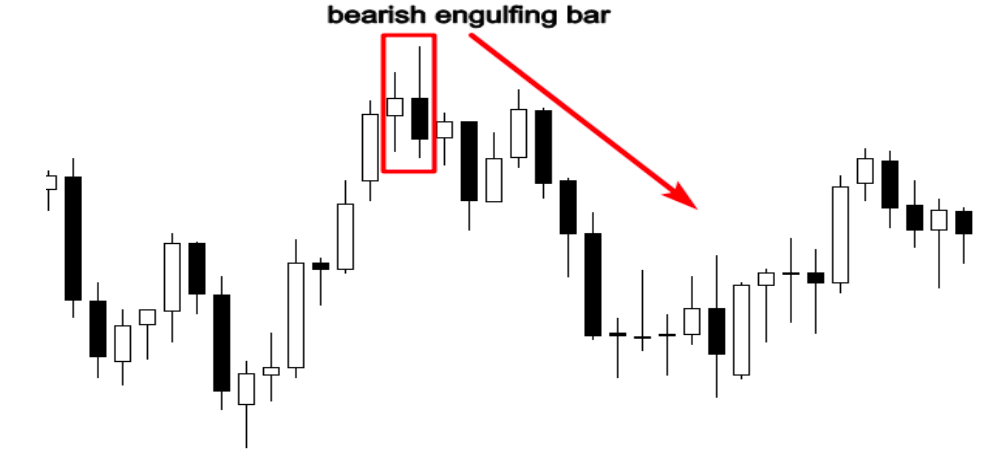
The originator of contemporary candlestick charting, Steve Nison, states that for a candle to be regarded as a reversal pattern, it must fulfill three crucial requirements:
- There is a definite rise or downtrend in the market.
- The engulfing candle is made up of two candlesticks, with the second one completely engulfing the first body.
- The first and second real bodies are diametrically opposed.
Discover Giant Hunter AI
How to trade the engulfing bar candlestick pattern price action signals?
Three crucial components must be adhered to in order to trade this chart candlestick pattern profitably:
- The pattern/trend
Any chart will show you that the market is occasionally moving sideways and other times it is definitely moving in one direction.
To be honest, the simplest strategy to profit from the market is to trade the engulfing bar pattern with the trend.
To identify whether the market is trending or not, you do not need to be an expert in technical analysis.
To put it simply, a market is in an uptrend if it is making a string of higher highs and lower lows, and a downtrend if it is making a string of lower highs and lower lows.
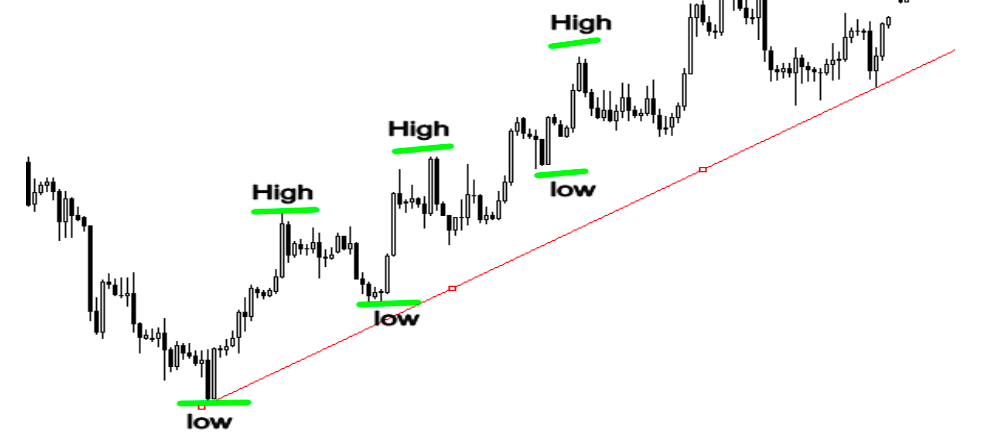
You can tell if the market is trending or not by looking at your chart and attempting to apply the idea of higher highs and higher lows and vice versa. The accompanying illustration clearly illustrates an uptrend.
Keep in mind that the markets move in trends when you are examining your charts. The most crucial component of your technical analysis is trading with the trend; nothing is more significant than the trend. You will incur significant costs if you attempt to control or oppose it.
No matter how effective your trading technique is, you cannot profit in any market situation. Instead, you must have enough patience and let the market determine the course of events.
Following the market’s direction is the first rule for mastering the engulfing bar pattern; in other words, the trend should be your best buddy, according to successful traders.
2.The Level
The next phase is to determine the most significant market levels when a clearly defined uptrend or decline has been identified. I refer to the strongest opposition and support.
All market participants keep an eye on this area since it offers a fantastic buying opportunity; if prices test a support level and stop, it indicates that buyers are there.
On the other hand, it is obvious that there is selling strength in the market if prices test a resistance level and cease an upward trend.
The following illustration demonstrates how market players engage with levels of support and resistance:
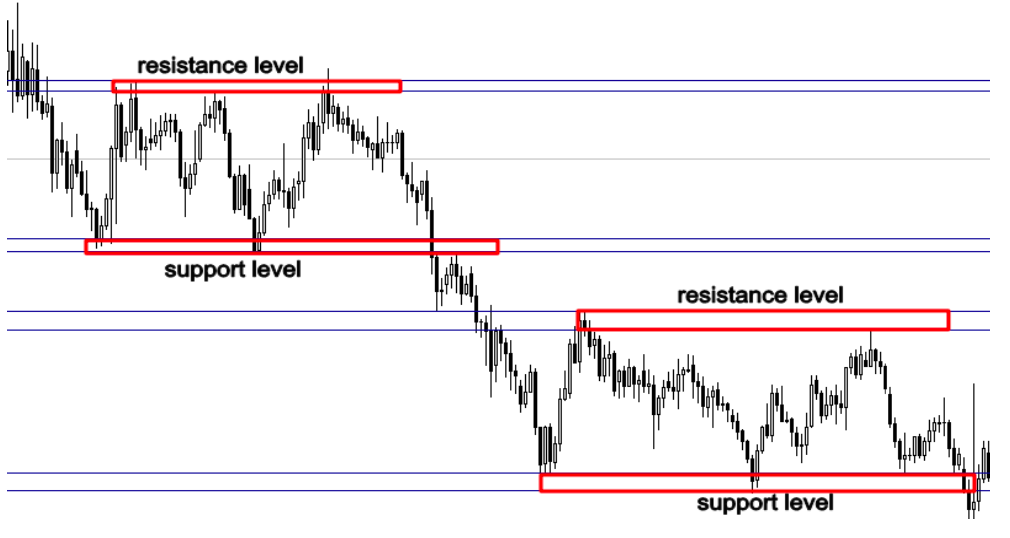
These levels can be represented by trend lines, channels, flags, triangles, and more. and being able to spot them on your chart will enable you to locate more advantageous market price levels.
When prices cross a resistance level in moving markets, that resistance may turn into support. To demonstrate how to trade the engulfing bar pattern with support and resistance in a bullish or bearish trend, refer to the example below:
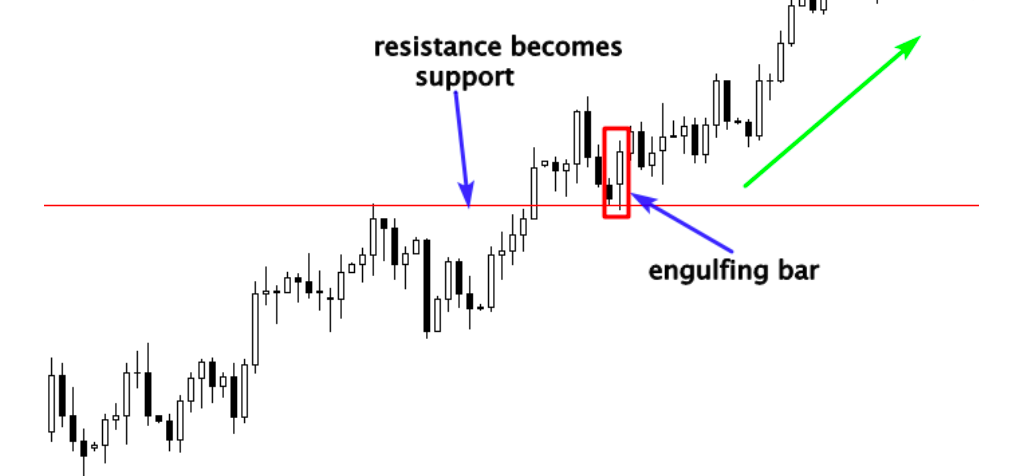
Moving averages, Fibonacci retracement ratios, and supply and demand zones are some other technical tools that might assist us in determining the optimal market levels.
- The signal
This indication is an engulfing bar pattern, and trading the inside bar candlestick pattern can be done using the same guidelines.
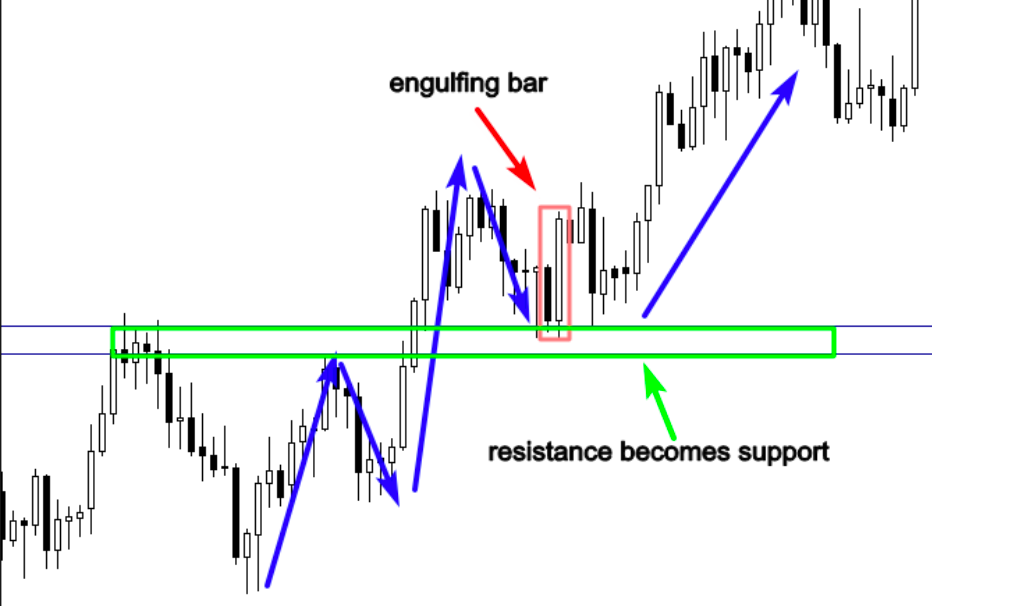
Your chances of making a profitable trade will significantly increase if you can see an engulfing candlestick at a crucial level in a certain uptrend or decline.
Below is another example:
Discover Giant Hunter AI
Trading the engulfing bar candlestick pattern with moving averages
Although trading the engulfing bar pattern with moving averages is a very profitable trading method, your trading account could be severely harmed if you do not know how to use the moving average.
Moving averages are used by traders in a variety of ways.
As a tool for trend tracking, they use them to determine the direction of the trend and purchase the market when prices are above the 200 simple moving average.
Additionally, when the market falls below the 200 simple moving average, they sell.
We just observe how prices interact with the moving averages to ascertain if the market is overbought or oversold. For instance, in an uptrend, if prices deviate significantly from the moving averages, this suggests that the market is overbought.
The crossover approach is used to predict changes in trends; a trend reversal is indicated if the moving average crosses over another.
Moving averages have drawbacks like any other trading strategy; therefore, you must understand how to use them effectively in the appropriate market circumstances.
Never attempt to use this trading technical tool in range-bound or untradeable markets, as it is not applicable to all markets.
Because your trading account will undoubtedly balloon up and you will receive a lot of false signals.
To the best of my knowledge, the greatest approach to profit from the market is to use an engulfing bar pattern signal in conjunction with the moving average, which acts as a dynamic support and resistance in trending markets.
The plan is straightforward: we will identify a clear bullish or bearish market, use the 21 and 8-simple moving averages in the daily and 4-hour time frames, and buy when the price pulls back to the moving average and an engulfing bar pattern appears.
View the following illustration:
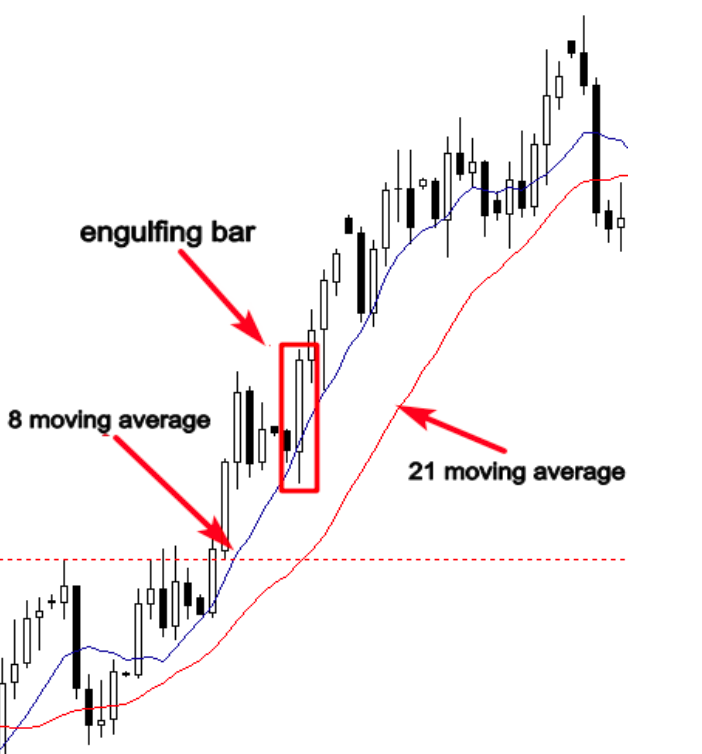
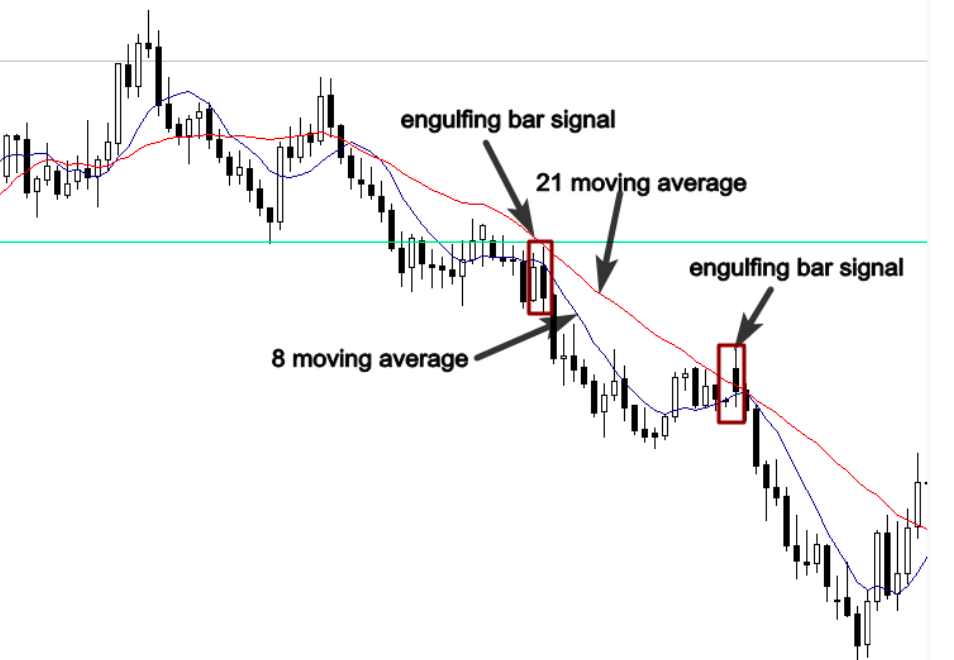
However, since a dropping moving average suggests that the market is in a negative trend, we sell when the price retraces to the moving average.
The screenshot below shows how prices interact with the moving average as a dynamic resistance level, and the engulfing bar pattern indicated a high probability setup.
How to trade the engulfing bar candlestick pattern with Fibonacci retracement
Although traders employ the Fibonacci retracement in a variety of ways, the 50% and 61% Fibonacci retracements are the most significant levels. By using this method in conjunction with a Japanese candlestick, you may undoubtedly increase your profit potential.
Chart specialists claim that the majority of significant moves retrace around 50% or 61% of the Fibonacci retracement; knowing this will enable you to accurately forecast the next significant move in a market that is trending.
The method is pretty straightforward: you first identify a distinct uptrend or downtrend, and then you use the Fibonacci retracement tool to identify important corrective levels. If an engulfing bar pattern coincides with 50% or 61% levels, it is a strong price action trading signal, as shown below.
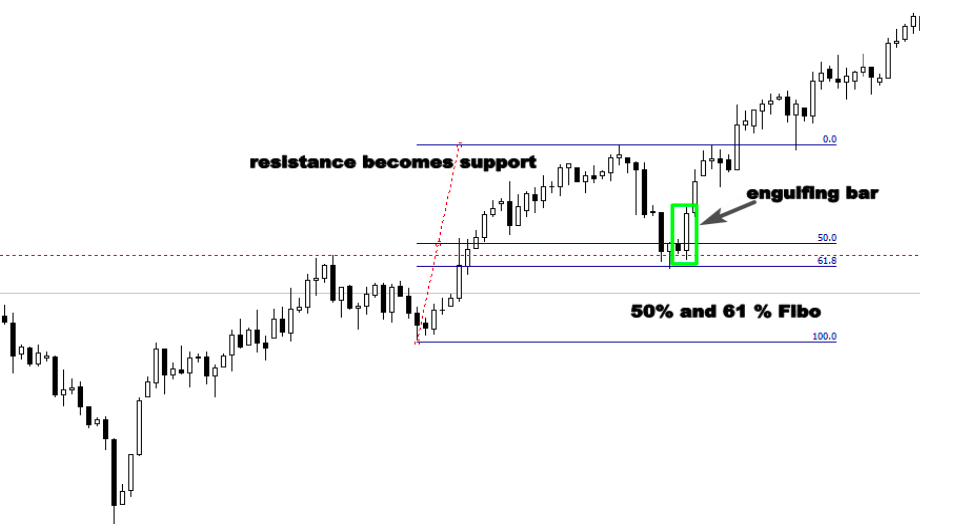
The resistance level that turns into support is another indication to follow this high probability setup, and in the example above, the engulfing bar price action signal aligns with the 50% and 61% Fibonacci retracement levels.
This trading method is incredibly effective; the next example further demonstrates the strength of the 50% and 61% Fibonacci retracements:

You can become one of the most successful traders by trading the market from 50% and 61% Fibonacci levels, which indicate that you are trading from higher price levels. This will place as many odds in your favor as you can.
Discover Giant Hunter AI
Trading the engulfing bar candlestick pattern with trendlines
Trend lines help skilled traders assess whether the market is optimistic or pessimistic by providing insight into the psychology of the market, particularly the psychology between buyers and sellers.
This technical trading tool can be used to identify price and time by drawing trend lines vertically, or it can be used to draw support and resistance horizontally. Trend lines can be used in any way.
Simply connecting price swing highs or lows to show a trend in trending markets allows us to identify high-probability entry setups that follow the market’s overall trend.
View the following illustration:

We had a trend line that served as a resistance level by joining the extreme highs, and the engulfing bar pattern’s creation indicates a strong selling opportunity.
You would lose out on this lucrative trade if you only employed horizontal support and resistance levels.
It is always a good idea to learn how to draw trend lines since they are the most straightforward analytical tool available for examining financial markets, including commodities, currencies, futures, and options.
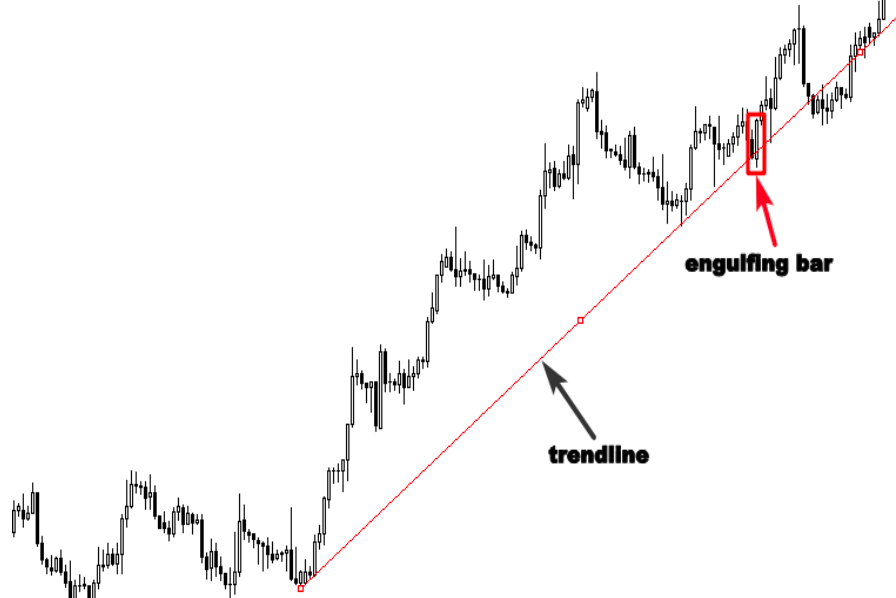
The price action signal that transpired offered a fantastic buying opportunity, and the trend line serves as a support level in the above chart, which displays a bullish trend.
Discover Giant Hunter AI
How to trade the engulfing bar in sideways markets?
Sideways and ranging markets can be among the hardest to predict. I generally advise traders to concentrate on trading trending markets, but the issue is that the markets spend over 70% of their time in range motion.
If you want to make a respectable living trading financial markets, you must learn how to approach range-bound markets because if you only concentrate on trending markets, you will likely leave a lot of money on the table.
What is a range-bound market?
The price begins to move between a certain high price and low price when the market stops creating higher highs and lower lows during an uptrend or lower highs and lower lows during a downtrend.
This is an obvious indication that the market is no longer moving and is instead ranging.
View the following illustration:
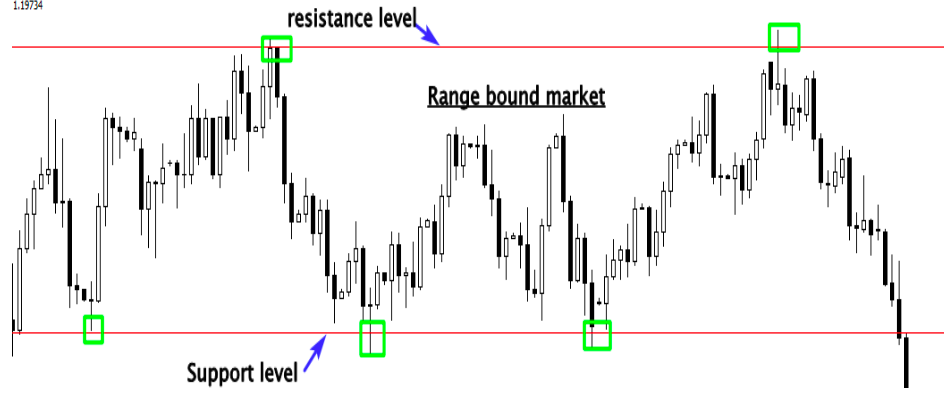
You cannot use the same strategies you employ in trending markets to trade engulfing bar patterns in range-bound markets because, as you can see in the example above, the market is trendless and trading between horizontal support and resistance.
For instance, you do not always drive the same way when you are in your car; for instance, you attempt to drive more slowly when you are downtown since you know that driving too quickly could endanger your life or the lives of others.
However, your driving style entirely alters when you are on a highway because you know you can go quickly. Thus, you always strive to modify your driving technique according to the circumstances.
All of the price action strategies we previously covered will not be effective in range-bound markets, therefore you must employ the appropriate strategies that are appropriate for these market conditions while trading the engulfing bar pattern.
In order to safeguard your trading account, you must be selective when trading range-bound markets before discussing the proper strategy for trading trendless markets. This is because not all sideways markets are worthwhile trading. You must be able to distinguish between markets that are choppy and sideways.
Take a look at the following example of bumpy markets:
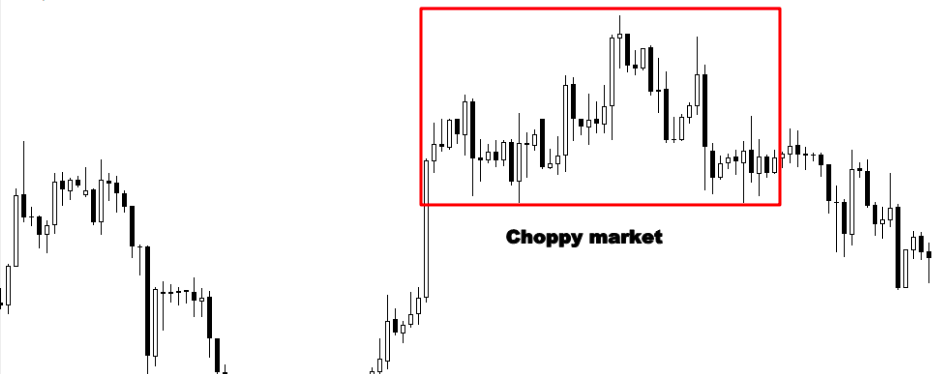
As seen above, the market moves erratically, making it impossible to pinpoint key resistance and support levels. Avoiding these kinds of markets is essential if you do not want to seriously harm your trading account.
It is quite easy to trade the engulfing bar candle in a range-bound market. The first tactic is to trade this price action pattern from significant support and resistance levels, as seen below:
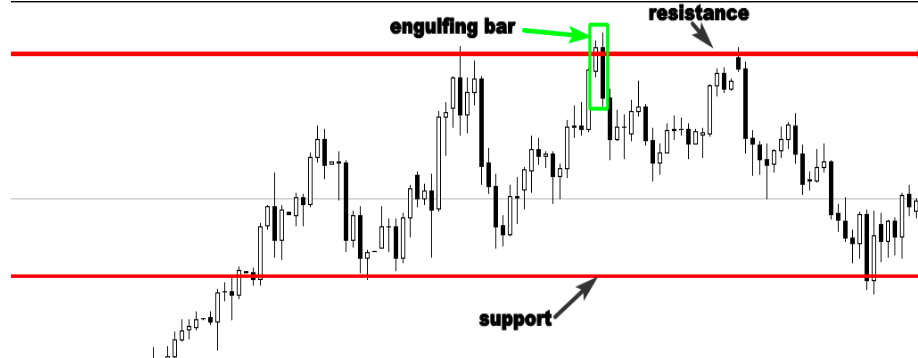
The second tactic is to either wait for the downturn or trade when the range breaks out. View the following illustration:
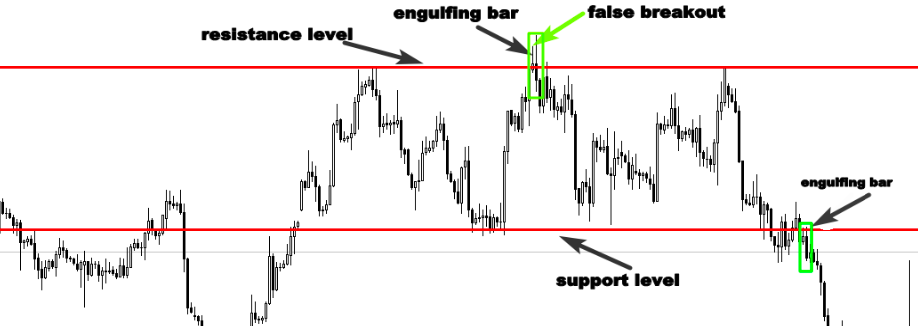
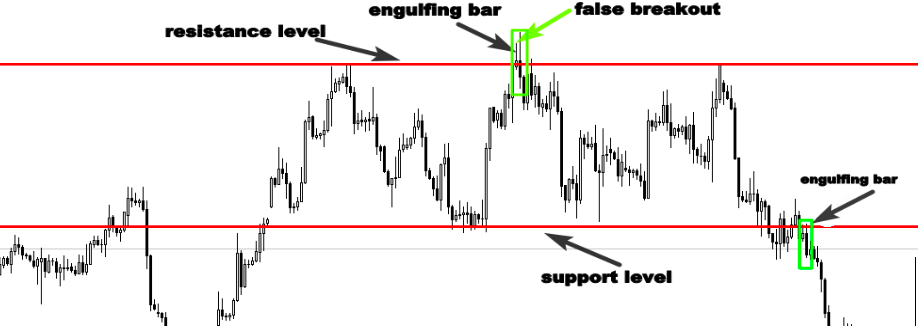
Trading the fake breakout of the main support or resistance level is the third tactic.
One of the most effective price action strategies is false breakouts, which can happen in any kind of market. If you know how to use them in conjunction with the engulfing bar pattern in a significant resistance or support level, you can profit from the market by strategically buying the bottoms and selling the tops.
View the following illustration:
Discover Giant Hunter AI
Trading the engulfing bar with supply and demand zones?
Supply and demand zones, where banks and other institutions are buying and selling in the market, are more potent than support and resistance. If you can spot these turning moments, you will be able to influence your trading account.
My experience has shown that in order to trade the engulfing bar pattern with supply and demand areas successfully, you must be able to recognize high-quality supply and demand levels on a chart. Three characteristics characterize high-quality supply and demand areas:
- The move’s strength: Pay closer attention to how the price exits the zone; if it does so rapidly, banks and other institutions are likely present.
- Good profit zone: You must ensure that the level offers a favorable risk/reward ratio.
- Larger time frames: The market’s most potent supply and demand zones are the daily and 4-hour ones.
The quality supply area is depicted in the chart below; as you can see, the move was quite powerful, indicating the presence of banks and other organizations.
The bears are still willing to sell from the same price level, as shown by the construction of an engulfing bar.

Here’s an additional illustration of these areas:
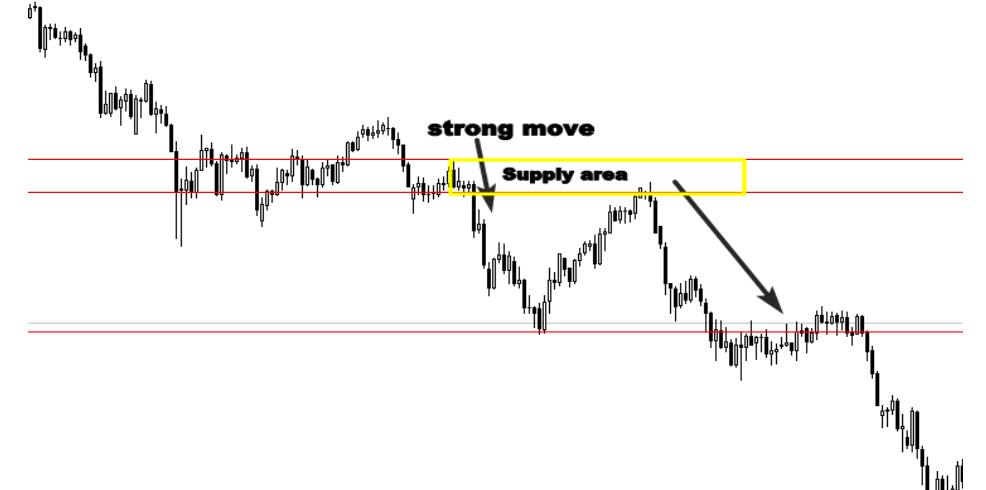
The secret behind supply and demand areas is that major players place their pending orders there, and when the market approaches these levels, we see a strong move from these levels. I believe that identifying these zones is not difficult because they are characterized by strong moves. If you can combine trading supply and demand areas with the engulfing bar price action signal, you will increase your chances of becoming a profitable trader.

