Time frame refers to the duration of each candlestick (or bar) on a price chart. It represents how much time has passed between the open and close of a particular candlestick. Time frames are crucial for traders as they help determine the overall market trend and guide entry and exit decisions.
Discover Giant Hunter AI

A successful price action trader doesn’t rely on just one timeframe for chart analysis. This is where top-down analysis comes into play. Top-down analysis means starting with the larger timeframes to get the big picture and then narrowing down to smaller timeframes to determine the best entry points.
For example, if you plan to trade the 4-hour time frame chart, you should first examine the weekly time frame chart and then the daily time frame chart. If the analysis on the weekly and daily charts aligns with the signals on the 4-hour chart, you can proceed with your trade. Similarly, if you’re trading the 1-hour chart, start by analyzing the daily chart first. This critical step helps you avoid low-probability setups and keeps you focused on higher-probability price action signals.
Through top-down analysis, we always begin with the larger timeframes to gather key information, such as:
-
- Important support and resistance levels: These levels act as potential turning points in the market. By identifying them on the weekly chart, you’ll have a clearer understanding of what may happen when price reaches these levels on the 4-hour or 1-hour chart. This allows you to make informed decisions—whether to buy, sell, or ignore signals from the market.
-
- Market structure: By analyzing the weekly chart, you’ll be able to identify whether the market is trending up or down, ranging, or in a choppy condition. This broader view gives you insight into the behavior of large institutional investors and allows you to align your trades with their market movements on smaller timeframes, using the appropriate price action strategies.
-
- Previous candle: The last candle on the weekly chart is significant because it reflects the market’s behavior over the past week. It provides key insights into the market’s momentum and can give you clues about potential future moves. By identifying the pattern of this candle, you gain valuable information to guide your trading decisions.
Once you’ve gathered this information from the weekly chart, you can move on to the daily or 4-hour (4H) charts to analyze:
-
- Market condition: On the 4-hour chart, assess whether the market is trending up or down, ranging, or if it’s a choppy market. This helps you understand the current phase of the market before you make your trading decisions.
-
- Key levels: Identify the important levels on the 4-hour or daily charts, such as support and resistance, supply and demand areas, or key trend lines. These levels often act as turning points and provide useful guidance for entry and exit points.
-
- Price action signals: Look for specific candlestick patterns that act as signals for entering a trade. Common patterns include pin bars, engulfing bars, or inside bars, which provide clear buy or sell signals when combined with the larger market context.
Discover Giant Hunter AI

Let me now give you an example to demonstrate the importance of adopting the top-down analysis approach and what can happen if you neglect to consider the bigger timeframes before focusing on your primary chart. Here’s an illustration below:
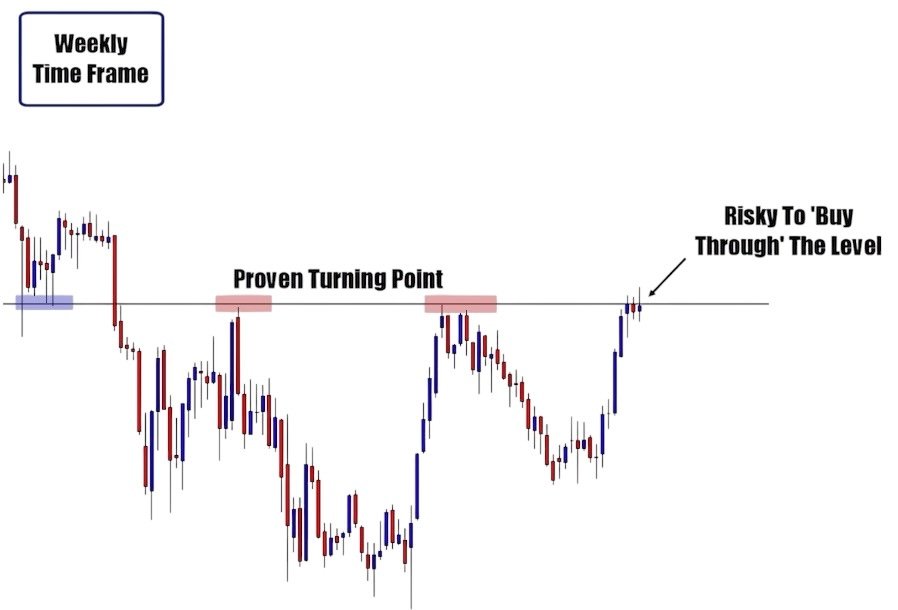
As observed in the weekly chart above, we’ve identified two crucial points that will guide our trading decisions on the daily timeframe.
-
- Important weekly resistance level: The market is approaching a significant resistance level on the weekly chart. This level is a key point where price is likely to encounter opposition, making it a critical area to watch.
-
- Rejection at the resistance level: We see that price was immediately rejected as it approached this resistance level, signaling that sellers are present and are actively shorting the market. This rejection indicates a potential shift in market sentiment.
To further confirm our analysis, we notice the formation of an inside bar false breakout pattern, which suggests a reversal. This pattern reinforces our belief that the market might not break through the resistance level but instead reverse from it.
Now, let’s shift to the daily timeframe to gain a clearer perspective on what’s happening with the market:
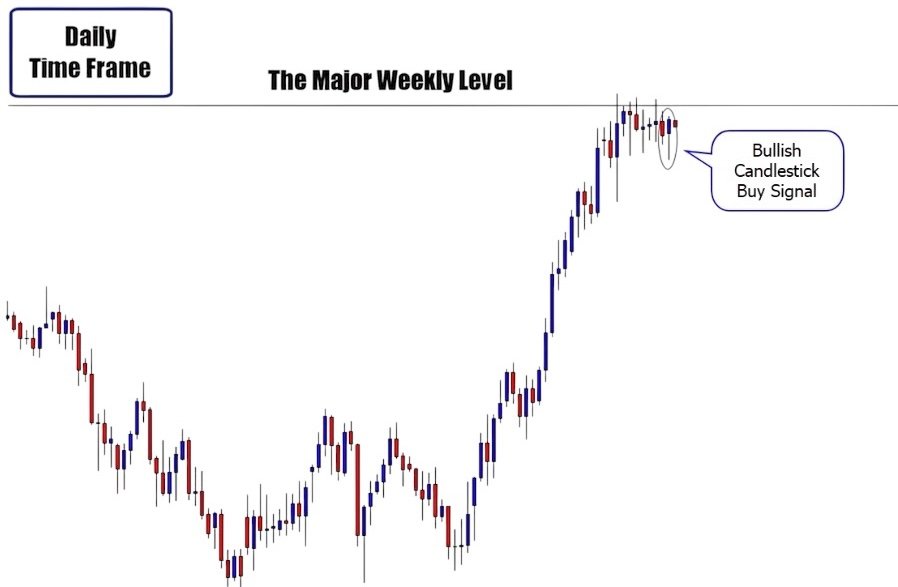
On the daily chart, we observe a clear pin bar candlestick pattern, which signals a bullish move. If you focus solely on the daily chart for your trading decision, you might decide to buy, as the pin bar suggests a potential upward movement.
However, when you analyze the weekly chart, you notice a strong key level that could act as resistance, preventing the market from continuing its upward trend. This information suggests that it might be wiser to consider selling if a clear signal emerges rather than buying.
Let’s now take a look at what happened next:
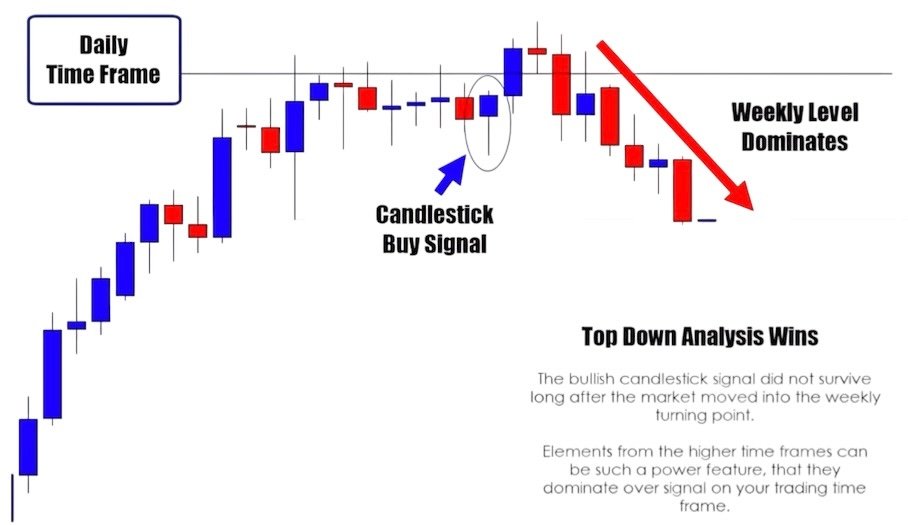
As you can see, the top-down analysis approach proved effective in this case. The pin bar candlestick signal failed because the weekly resistance level acted as a strong reversal point, reversing the market’s direction.
If you plan to trade price action based on just one time frame, I strongly recommend reconsidering your approach. Trading without a broader analysis will likely result in significant losses, and you may struggle to become a successful trader.
While trading counter-trends can be profitable, it is essential to combine price action setups with top-down analysis to avoid costly mistakes. Let me provide another example to demonstrate how you can trade counter-trends effectively when applying the top-down analysis concept.
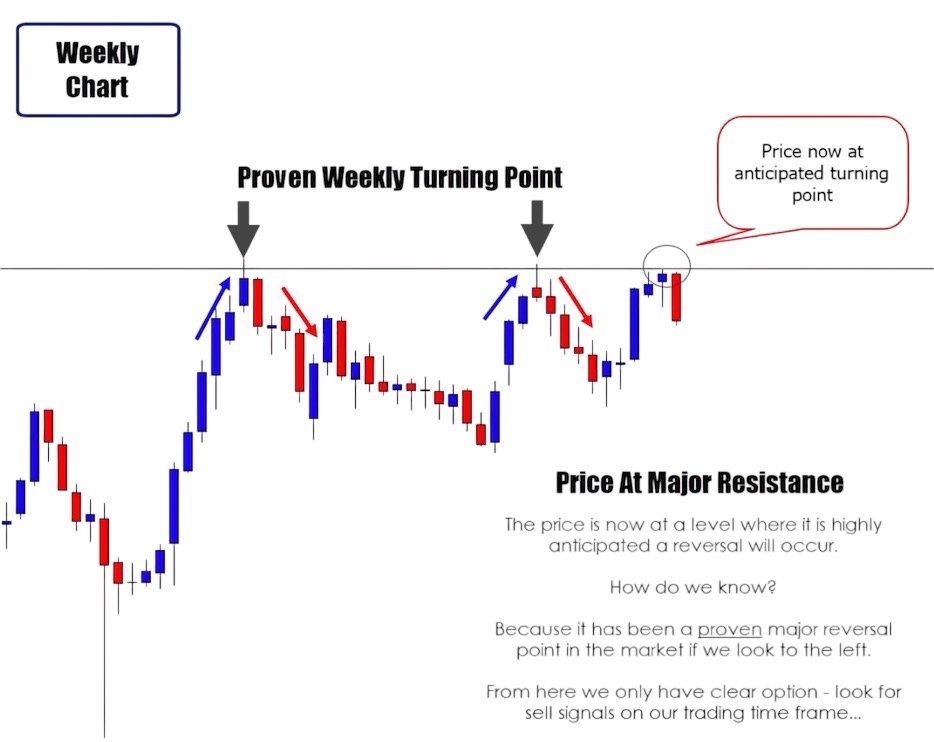
As shown in the chart above, prices are testing a weekly resistance level. Buyers were rejected twice from this level, signaling that the market is at a critical point and a reversal is likely.
As a price action trader, you should switch to the daily time frame to search for a selling opportunity. If you can identify a price action setup near the weekly resistance level on the daily chart, this would be a high-probability setup worth considering.
Check out the example below for a clearer illustration:
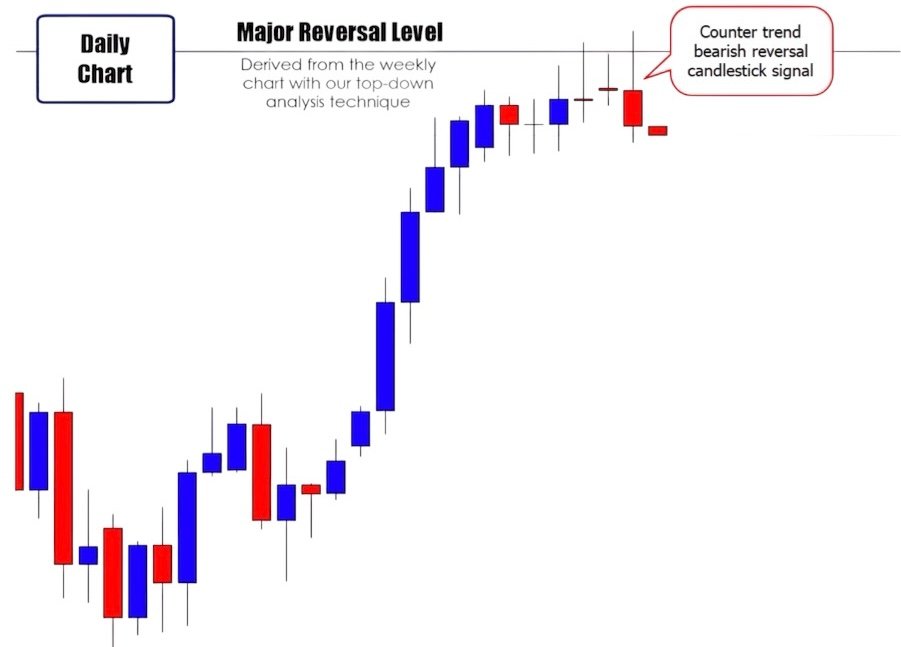
The daily time frame chart above confirms our weekly analysis. As you can see, there is a clear bearish signal near the weekly resistance level. The pin bar was rejected from that level, and there is also the formation of an inside bar false breakout.
This combination strongly suggests trend reversal. Let’s look at what happened next:

The example above demonstrates that counter-trend trading can be effective when mastered, but it requires experience. If you’re a beginner, it’s highly recommended to focus on trading with the trend. Practice the top-down analysis approach with the trend until you feel confident, and once you’re comfortable, you can gradually explore high-probability counter-trend setups.
There are many methods to time market turns and plan trades, but most of these methods often lead to confusion and a lack of confidence in the results. Keeping your analysis simple is often the best approach, and mastering top-down analysis is one of the easiest and most effective ways to trade successfully.
What you should do now is open your charts and begin practicing the concepts you’ve learned in this chapter.
Try to identify the market trend using these techniques. It will be a little confusing at the beginning, but with some screen time and practice, you will find it easy to identify the market direction.
Discover Giant Hunter AI

