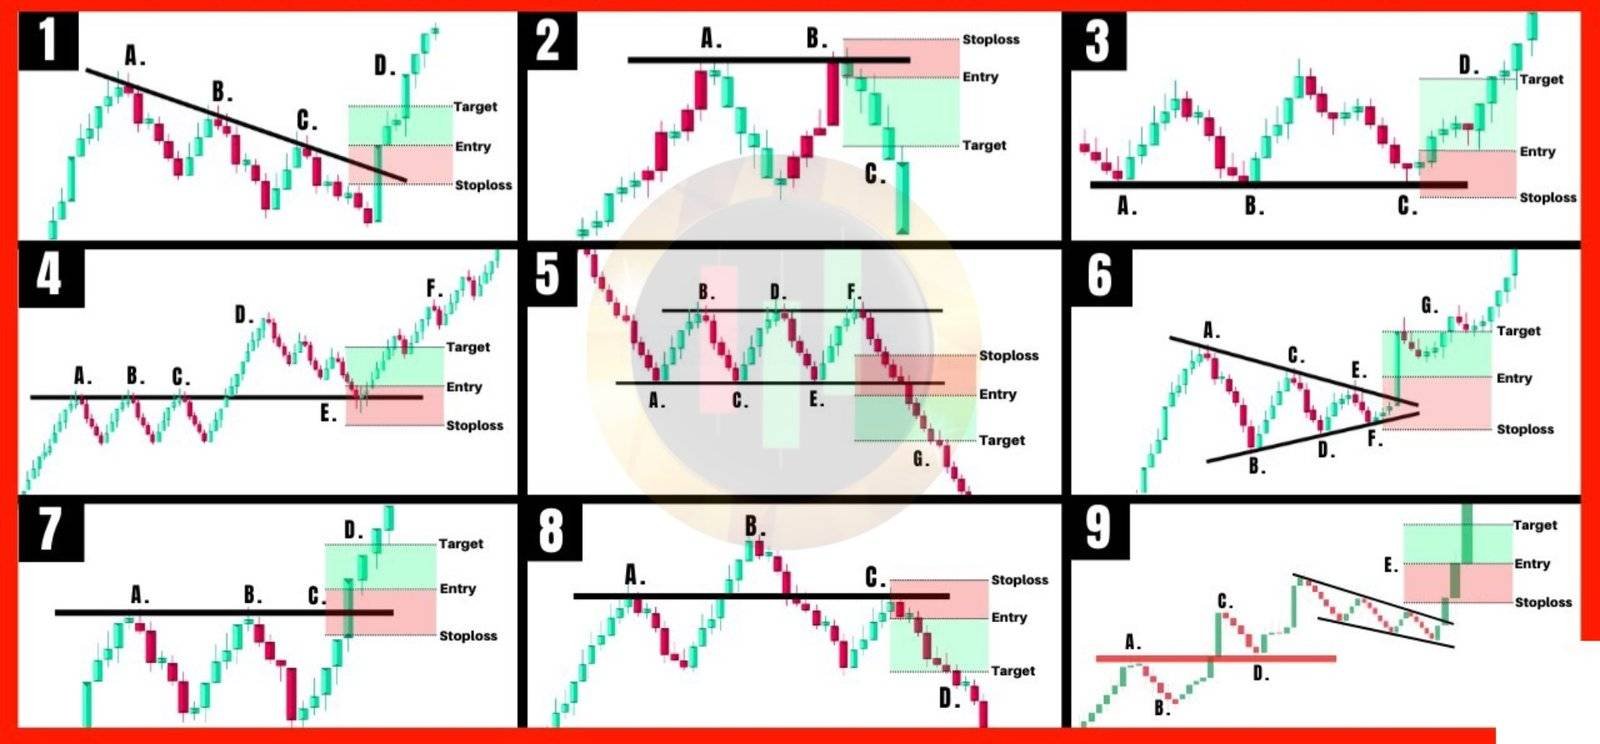
Trading strategies and tactics is now our main topic because, in recent chapters, you’ve covered three crucial elements of price action trading:
First, market trends: you now know how to spot trends by analyzing multiple time frames, distinguishing between trending and range-bound markets, and understanding how each type moves.
Second, levels: you’ve learned to mark support and resistance levels and draw trend lines, enabling you to time your market entries more effectively.
Third, signals: you’ve studied various candlestick patterns, understanding the psychology behind them and what they communicate.
These three components—trend, level, and signal—form the foundation of our trading strategy across any financial market.
When you examine a chart, you’ll focus on answering three key questions:
- What is the market’s current state? Is it trending, consolidating, or choppy?
- If trending, you’ll identify whether it’s an uptrend or downtrend.
- In a range-bound market, the price moves within horizontal boundaries.
- For choppy markets, it’s best to avoid trading.
- Where are the strongest levels in this market?
- In both trending and ranging conditions, identify the key support and resistance zones, as these are prime areas for buying and selling.
- What is the optimal signal for market entry?
- Finding the right entry signal means recognizing the best moment to execute a trade.
The next chapter will guide you on this journey, helping you fine-tune these skills for effective trading decisions.
Discover Giant Hunter AI

The pin bar candlestick pattern strategy
The pin bar candlestick is a prominent chart pattern commonly employed by price action traders to identify potential reversal points in the market.
In this section, you will explore in depth how to recognize possible pin bar signals and the necessary conditions for creating high-probability setups.
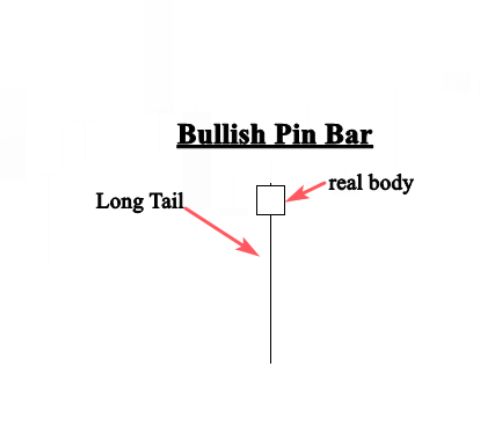
A pin bar is a specific type of candlestick that features an exceptionally long tail, indicating rejection and suggesting that the market may reverse direction.
The section between the opening and closing prices is known as the real body. Typically, pin bars have a very small real body accompanied by an extended shadow.
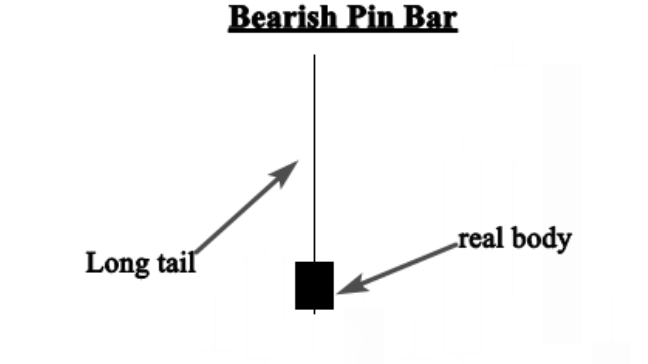
A bullish pin bar is characterized by a long lower wick, while a bearish pin bar has a significant upper wick. Although the color of the candlestick isn’t the most critical factor, bullish candles with a white real body tend to be more influential than those with a black real body.
Similarly, bearish pin bars with black real bodies are generally more impactful than those with white real bodies.
Below are examples illustrating the appearance of pin bars:
How to identify pin bar candlestick setups?
Truthfully, perfect price action setups are rare in the market. At times, you may identify a high-probability setup, feel confident about the trade, and yet find yourself frustrated when the signal doesn’t play out as expected. This often happens because market movements are driven not by pin bar formations alone but by the forces of supply and demand.
For example, spotting a strong pin bar near a support level in an uptrend may suggest a solid buying opportunity, which shouldn’t be ignored. However, if buyers are investing less money into the trade than sellers are risking, the market might move contrary to your expectations.
If a setup fails, it doesn’t necessarily mean your analysis was flawed or that pin bars are ineffective; it simply means the market didn’t align with your expectations. Accepting these outcomes and seeking the next opportunity is key.
You may wonder why we rely on pin bar setups if they don’t always yield results. Remember, trading is about probabilities, not guarantees. Evaluating pin bar setups from multiple perspectives helps stack the odds in your favor, which is essential to a successful trading approach.
For a pin bar to be a valuable trading signal, it should meet specific criteria:
- The pin bar should appear on higher time frames, like the 4-hour or daily chart. Smaller time frames are filled with pin bars, many of which produce false signals. So focusing on larger time frames can help reduce false setups.
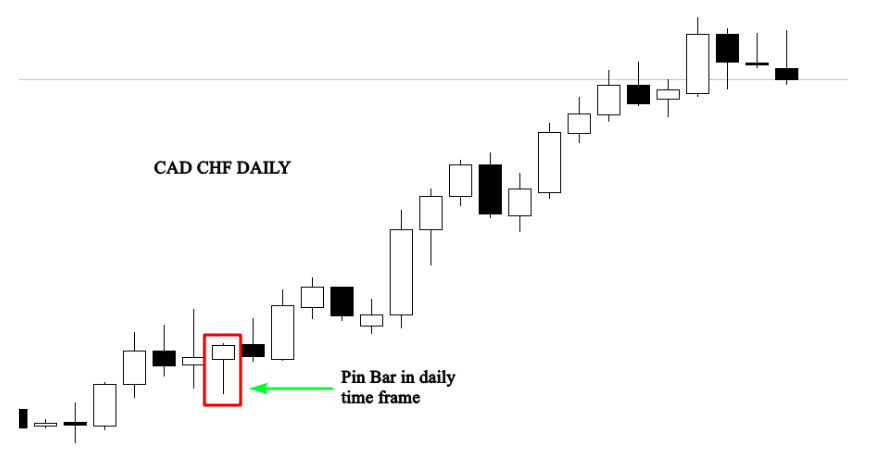
- A pin bar that aligns with the market’s overall trend is generally more reliable than one that forms against the trend.
- Identifying a clear trend reveals who holds market control, making setups that form with the prevailing trend more impactful.
This alignment between the pin bar and the trend is what enhances the effectiveness of this candlestick pattern.
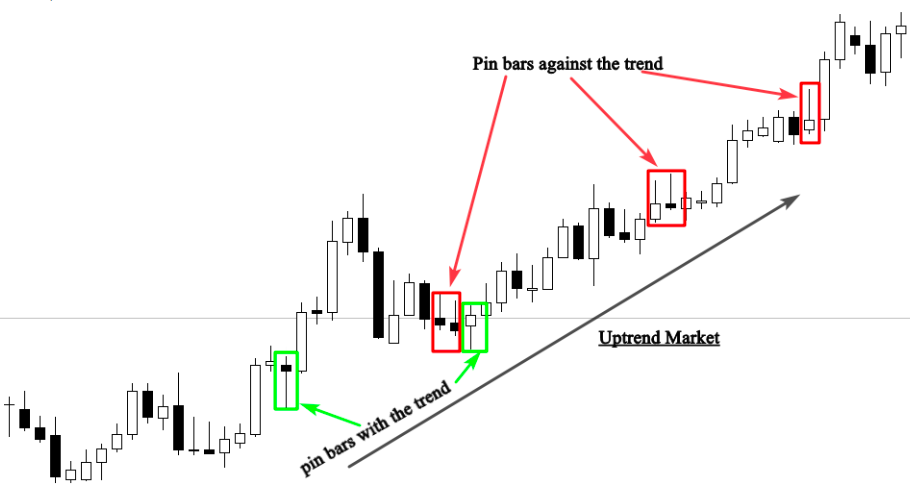
As shown in the chart, bullish pin bars that appear within an uptrend are effective and should be considered, while bearish pin bars forming against the trend are best ignored.
- The structure of a pin bar is also crucial; confirming it as a true pin bar involves examining the proportion of the real body to the tail.
- Pin bars with longer tails are generally more powerful indicators.
Discover Giant Hunter AI

The psychology behind the pin bar candle formation:
Pin bars form when prices experience rejection; however, this rejection alone doesn’t guarantee a reversal signal, as pin bars can appear anywhere on the chart.
The most significant areas to monitor for trading pin bars are key levels such as support and resistance, supply and demand zones, and moving averages. When a pin bar forms near these levels, it provides valuable insight into market dynamics.
For instance, if a rejection occurs near a support level, it typically signals that buyers (bulls) have the upper hand and may drive the market upward.
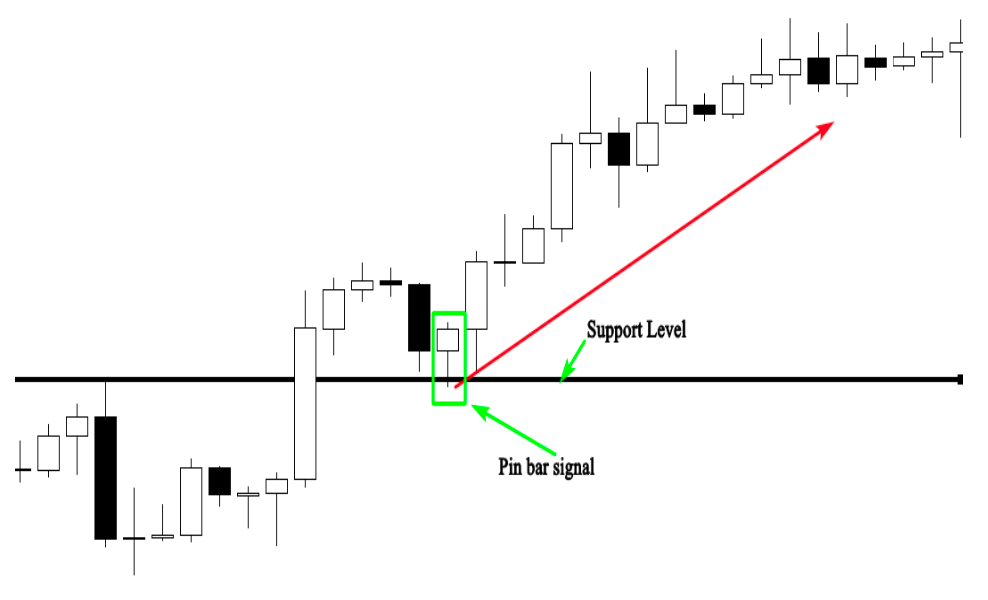
When a pin bar forms near a resistance level, it signals that sellers (bears) are pushing back, preventing buyers (bulls) from breaking above this level.
This suggests that sellers are prepared to drive the market downward.
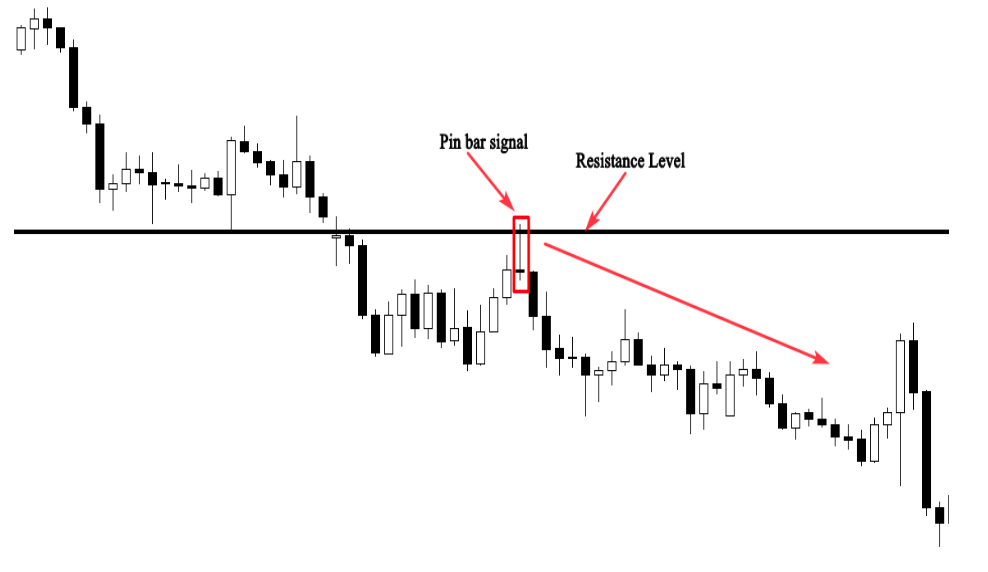
Grasping the psychology behind the formation of this price action pattern enables you to anticipate future market movements, allowing you to make informed trades based on high-probability pin bar signals.
Discover Giant Hunter AI

Trading the pin bar candlestick with the trend
For beginner traders, it’s best to focus on trading with the trend, as pin bars that appear in trending markets often present favorable opportunities with a high risk/reward ratio. Once you become skilled in trading with the trend, you can explore range-bound markets or even counter-trend trades.
This strategy is straightforward: begin by identifying a clear uptrend or downtrend, then wait for a pin bar to form following a pullback to a support or resistance level.
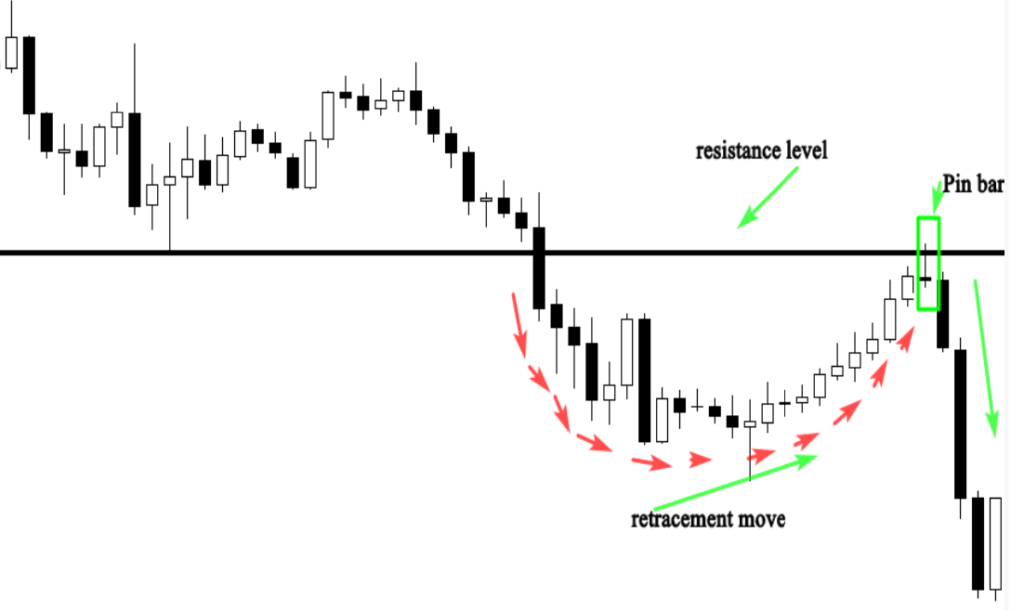
The figure below demonstrates how this price action signal works when traded with the trend. As shown, the price is rejected at the resistance level, indicating that sellers (bears) are still controlling the downtrend.
The pin bar formation signals the end of the retracement and the start of the impulsive move at the resistance level, aligning with the overall downtrend.
This is a high-quality setup because it meets the following criteria:
- The pin bar is well-formed and aligns with the market direction.
- The rejection occurs at a major key level (resistance), a critical point in the market.
- The risk-to-reward ratio is favorable, making it a worthwhile trade.
However, in certain situations, even if the market is trending, it may not be possible to draw clear support and resistance levels, as price movements can become more dynamic. In such cases, the 21-period moving average can serve as dynamic support in an uptrend and dynamic resistance in a downtrend.
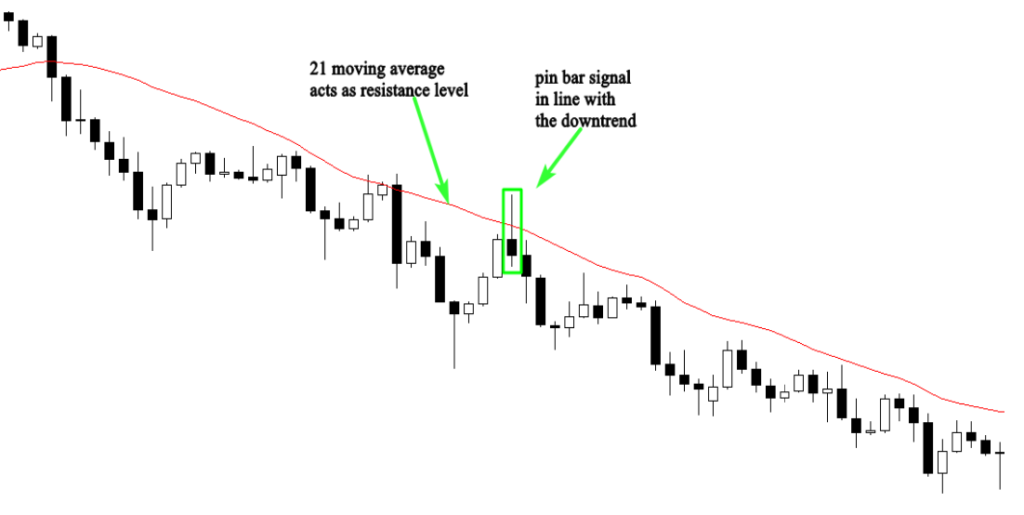
As illustrated in the chart above, when the market is trending downward, the 21-period moving average helps identify dynamic resistance levels. This allows for recognizing high-probability pin bar setups that align with the market’s movement.
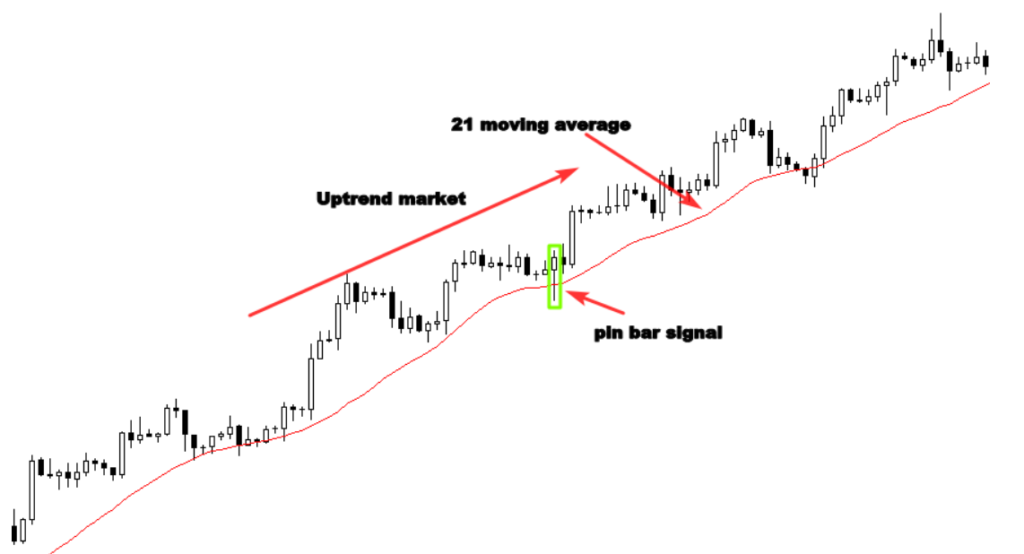
The 4-hour chart above shows how the 21-period moving average can help identify key points in the market. When the price approaches the moving average, buying pressure tends to emerge, causing the price to rise.
The pin bar signal on the chart is clear: since the trend is bullish, the price action setup aligns with this, and the rejection from the 21-period moving average serves as a confirmation to buy the market.
Discover Giant Hunter AI

